

Question: Wrong answer = dislike 4 0 3 9 3 8 3 7 1 8 . Make the cell range S 1 2 :T 1 2
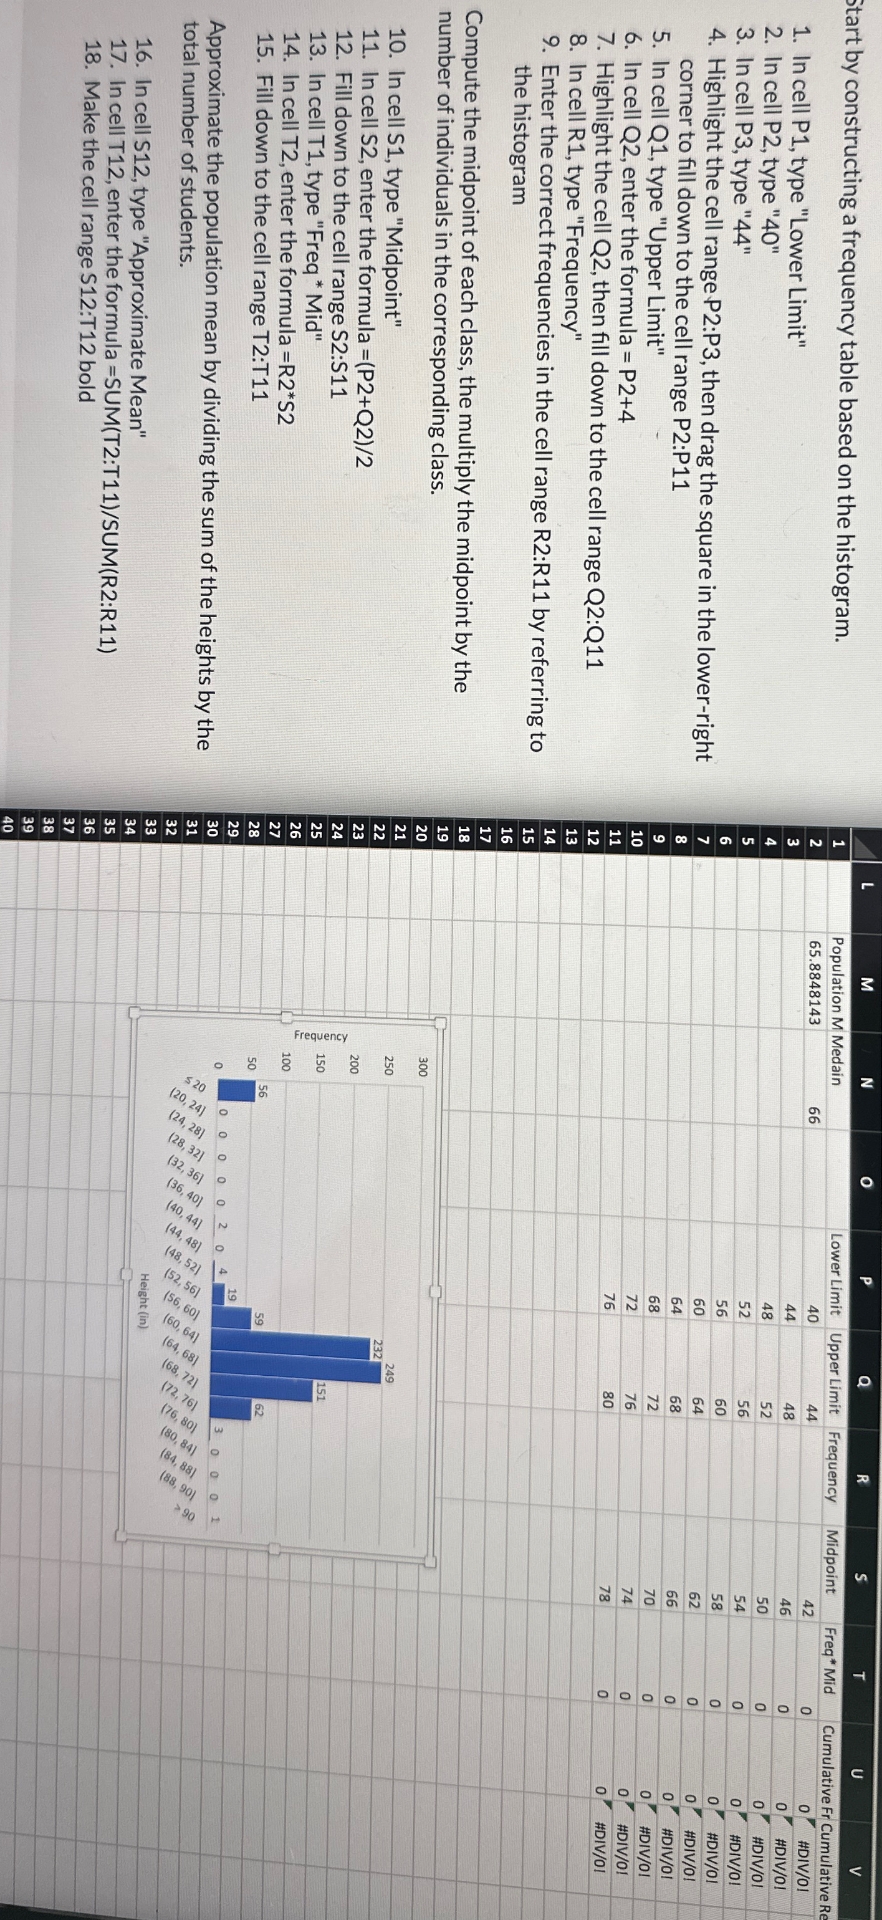
Wrong answer dislike Make the cell range S:T bold In cell T enter the formula SUMT:TSUM R:R In cell S type "Approximate Mean"Height intotal number of students.Approximate the population mean by: o Fill In cell T enter the formula RS In cell T type "Freq Mid" Fill down to the cell range S:S In In cell Snumber of individuals in the corresponding class.Compute the midpoint of each class, the multiply the midpoint by thethe histogram Enter the correct frequencies in the cell range R:R by referring to In cell R type "Frequency" Highlight the cell Q then fill down to the cell range Q:Q In cell Q enter the formula P In cell Q type "Upper Limit"corner to fill down to the cell range P:P Highlight the cello#DIVo#DIVo#DIVOI#DIVO#DIVOI In cell P type o#DIVo In cel Ptype In cell PPopulation M MedainStart by constructing a frequency table based on the histogram.Lower Limit Upper Limit FrequencyMidpointFreg MidCumulative Fr Cumulative Reo#DIVo#DIVOo #DIVoIMNRVdividing the sum of the heights by thedown to thecell rangeT:Tcell S enter the formula PQtype "Midpoint"#DIVorangeP:Pthen drag the square in the lowerrighttype Lower Limit
Step by Step Solution
There are 3 Steps involved in it
1 Expert Approved Answer
Step: 1 Unlock

Question Has Been Solved by an Expert!
Get step-by-step solutions from verified subject matter experts
Step: 2 Unlock
Step: 3 Unlock