

Question: X -5 10 -5 -10 Use the graph to answer the question. Determine the interval on which this function is constant. O A. (4,00) O
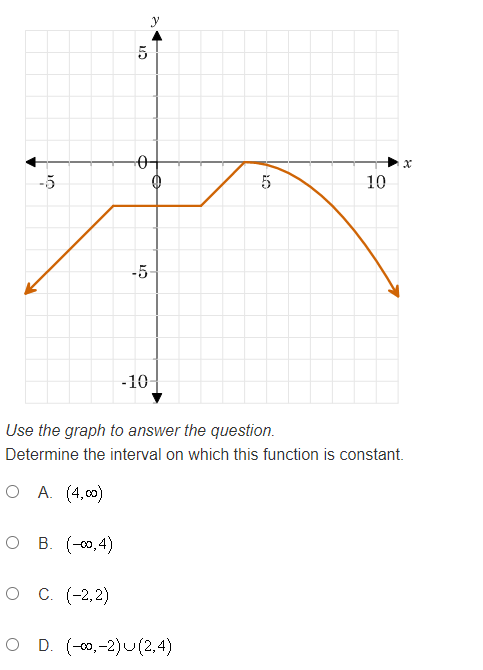
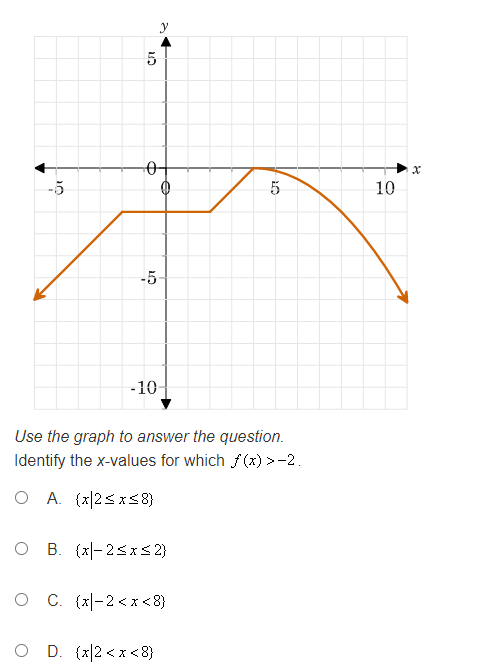
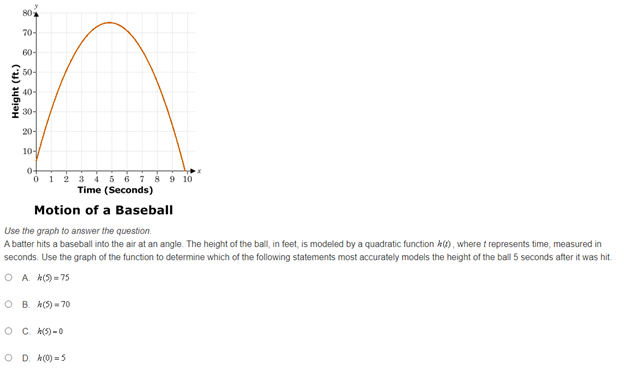
X -5 10 -5 -10 Use the graph to answer the question. Determine the interval on which this function is constant. O A. (4,00) O B. (-00,4 ) O C. (-2,2) O D. (-co, -2) (2,4)5 -5 10 -5 -10- Use the graph to answer the question. Identify the x-values for which f (x) >-2 O A. (x 2 x-4) O B. (x x 3) O C. (x x>1) O D. (x x20)Y 80 70- 60- 50- Height (ft.) 40 30- 20- 10- 0 0 2 3 5 6 7 8 9 10 Time (Seconds) Motion of a Baseball Use the graph to answer the question. A batter hits a baseball into the air at an angle. The height of the ball, in feet, is modeled by a quadratic function *(), where t represents time, measured in seconds. Use the graph of the function to determine which of the following statements most accurately models the height of the ball 5 seconds after it was hit O A. *(5 75 O B. A(5)-70 O C. AS-0 O D. A(0) = 5
Step by Step Solution
There are 3 Steps involved in it

Get step-by-step solutions from verified subject matter experts