

Question: x B Hornepage - Southern X @ Mail - Guy, Kaye - Out X zy Section 3.1 - MAT 240: X course hero - Bing
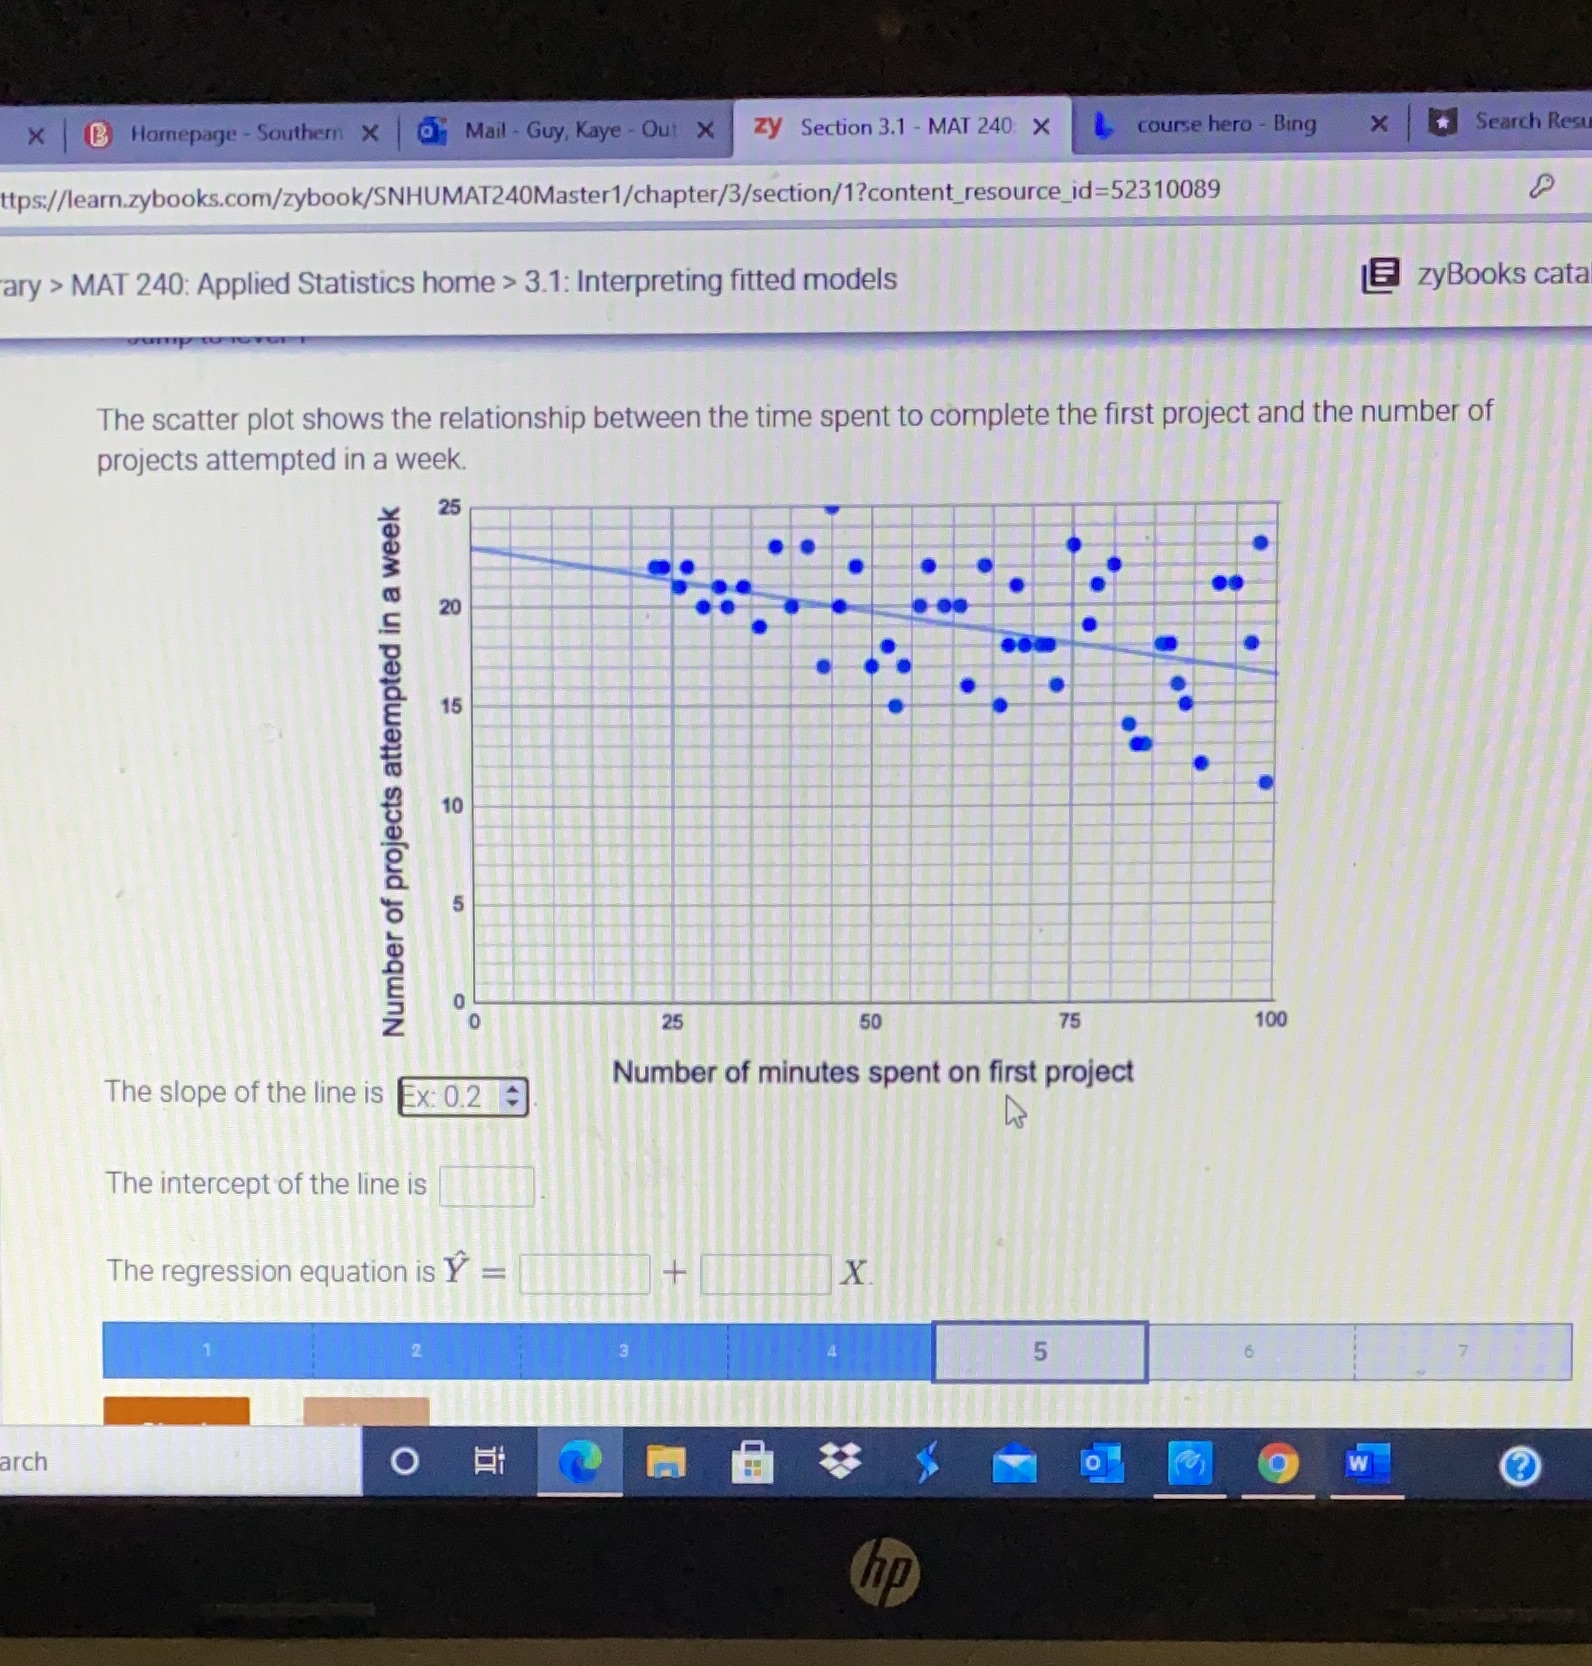
x B Hornepage - Southern X @ Mail - Guy, Kaye - Out X zy Section 3.1 - MAT 240: X course hero - Bing * * Search Res tps://learn.zybooks.com/zybook/SNHUMAT240Master1/chapter/3/section/1?content_resource_id=52310089 ary > MAT 240: Applied Statistics home > 3.1: Interpreting fitted models zyBooks cata The scatter plot shows the relationship between the time spent to complete the first project and the number of projects attempted in a week. 25 20 15 Number of projects attempted in a week 10 25 50 75 100 The slope of the line is Ex: 0.2 # Number of minutes spent on first project The intercept of the line is The regression equation is Y = X. 2 5 7 arch o W
Step by Step Solution
There are 3 Steps involved in it

Get step-by-step solutions from verified subject matter experts