

Question: x Bb untitled X Bb MAT103_LN X + BD Pearson's M X Take a Test X Bb Microsoft V X Bb Chapter 6 x Bb
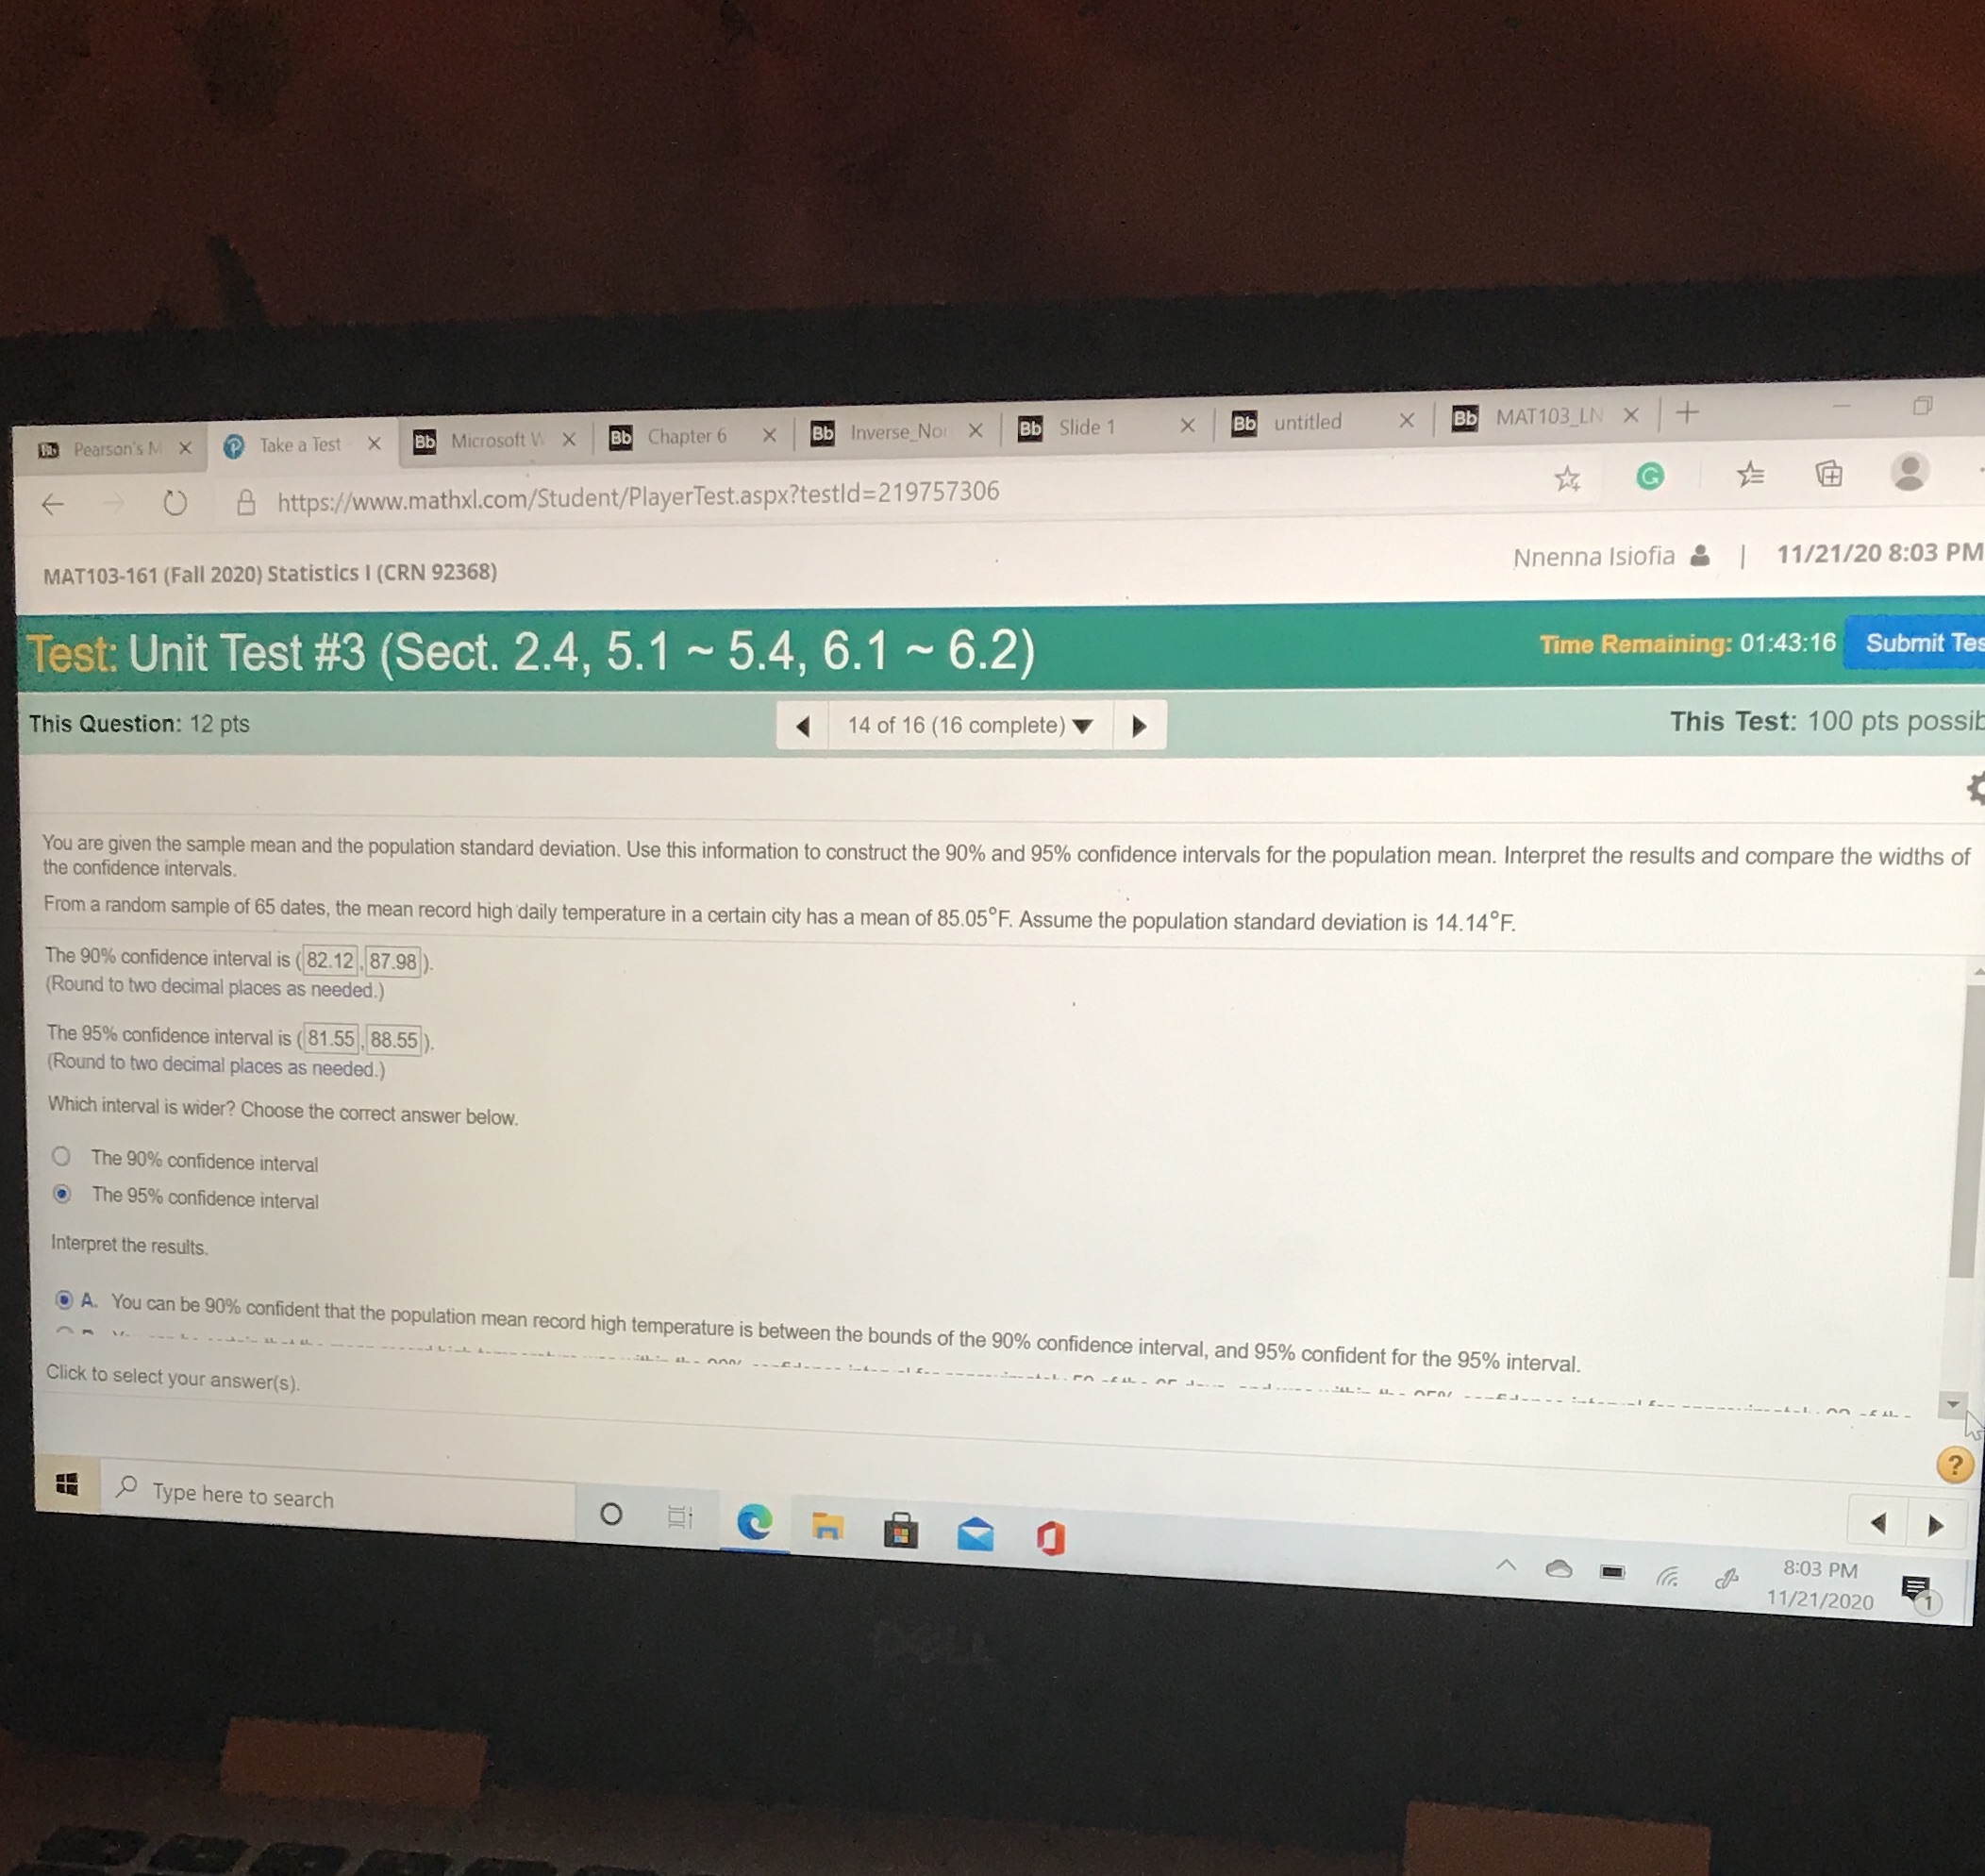
x Bb untitled X Bb MAT103_LN X + BD Pearson's M X Take a Test X Bb Microsoft V X Bb Chapter 6 x Bb Inverse_Not X Bb Slide 1 G https://www.mathxl.com/Student/PlayerTest.aspx?testld=219757306 Nnenna Isiofia & | 11/21/20 8:03 PM MAT103-161 (Fall 2020) Statistics I (CRN 92368) Test: Unit Test #3 (Sect. 2.4, 5.1 ~ 5.4, 6.1 ~ 6.2) Time Remaining: 01:43:16 Submit Te This Test: 100 pts possib This Question: 12 pts 14 of 16 (16 complete) You are given the sample mean and the population standard deviation. Use this information to construct the 90% and 95% confidence intervals for the population mean. Interpret the results and compare the widths of the confidence intervals. From a random sample of 65 dates, the mean record high daily temperature in a certain city has a mean of 85.05.F. Assume the population standard deviation is 14. 14 F. The 90% confidence interval is ( 82.12 , 87.98 ) (Round to two decimal places as needed.) The 95% confidence interval is ( 81.55 , 88.55 ). Round to two decimal places as needed.) Which interval is wider? Choose the correct answer below. The 90% confidence interval The 95% confidence interval Interpret the results. A. You can be 90% confident that the population mean record high temperature is between the bounds of the 90% confidence interval, and 95% confident for the 95% interval. Click to select your answer(s) - - - 4 - 1. . an - fil - ? Type here to search O 8:03 PM 11/21/2020
Step by Step Solution
There are 3 Steps involved in it

Get step-by-step solutions from verified subject matter experts