Question: X Cut Arial ~ 10 -AA de Wrap Text Number LE Copy B U Merge & Center Format Painter Clipboard Alignment Number F Herman Miller
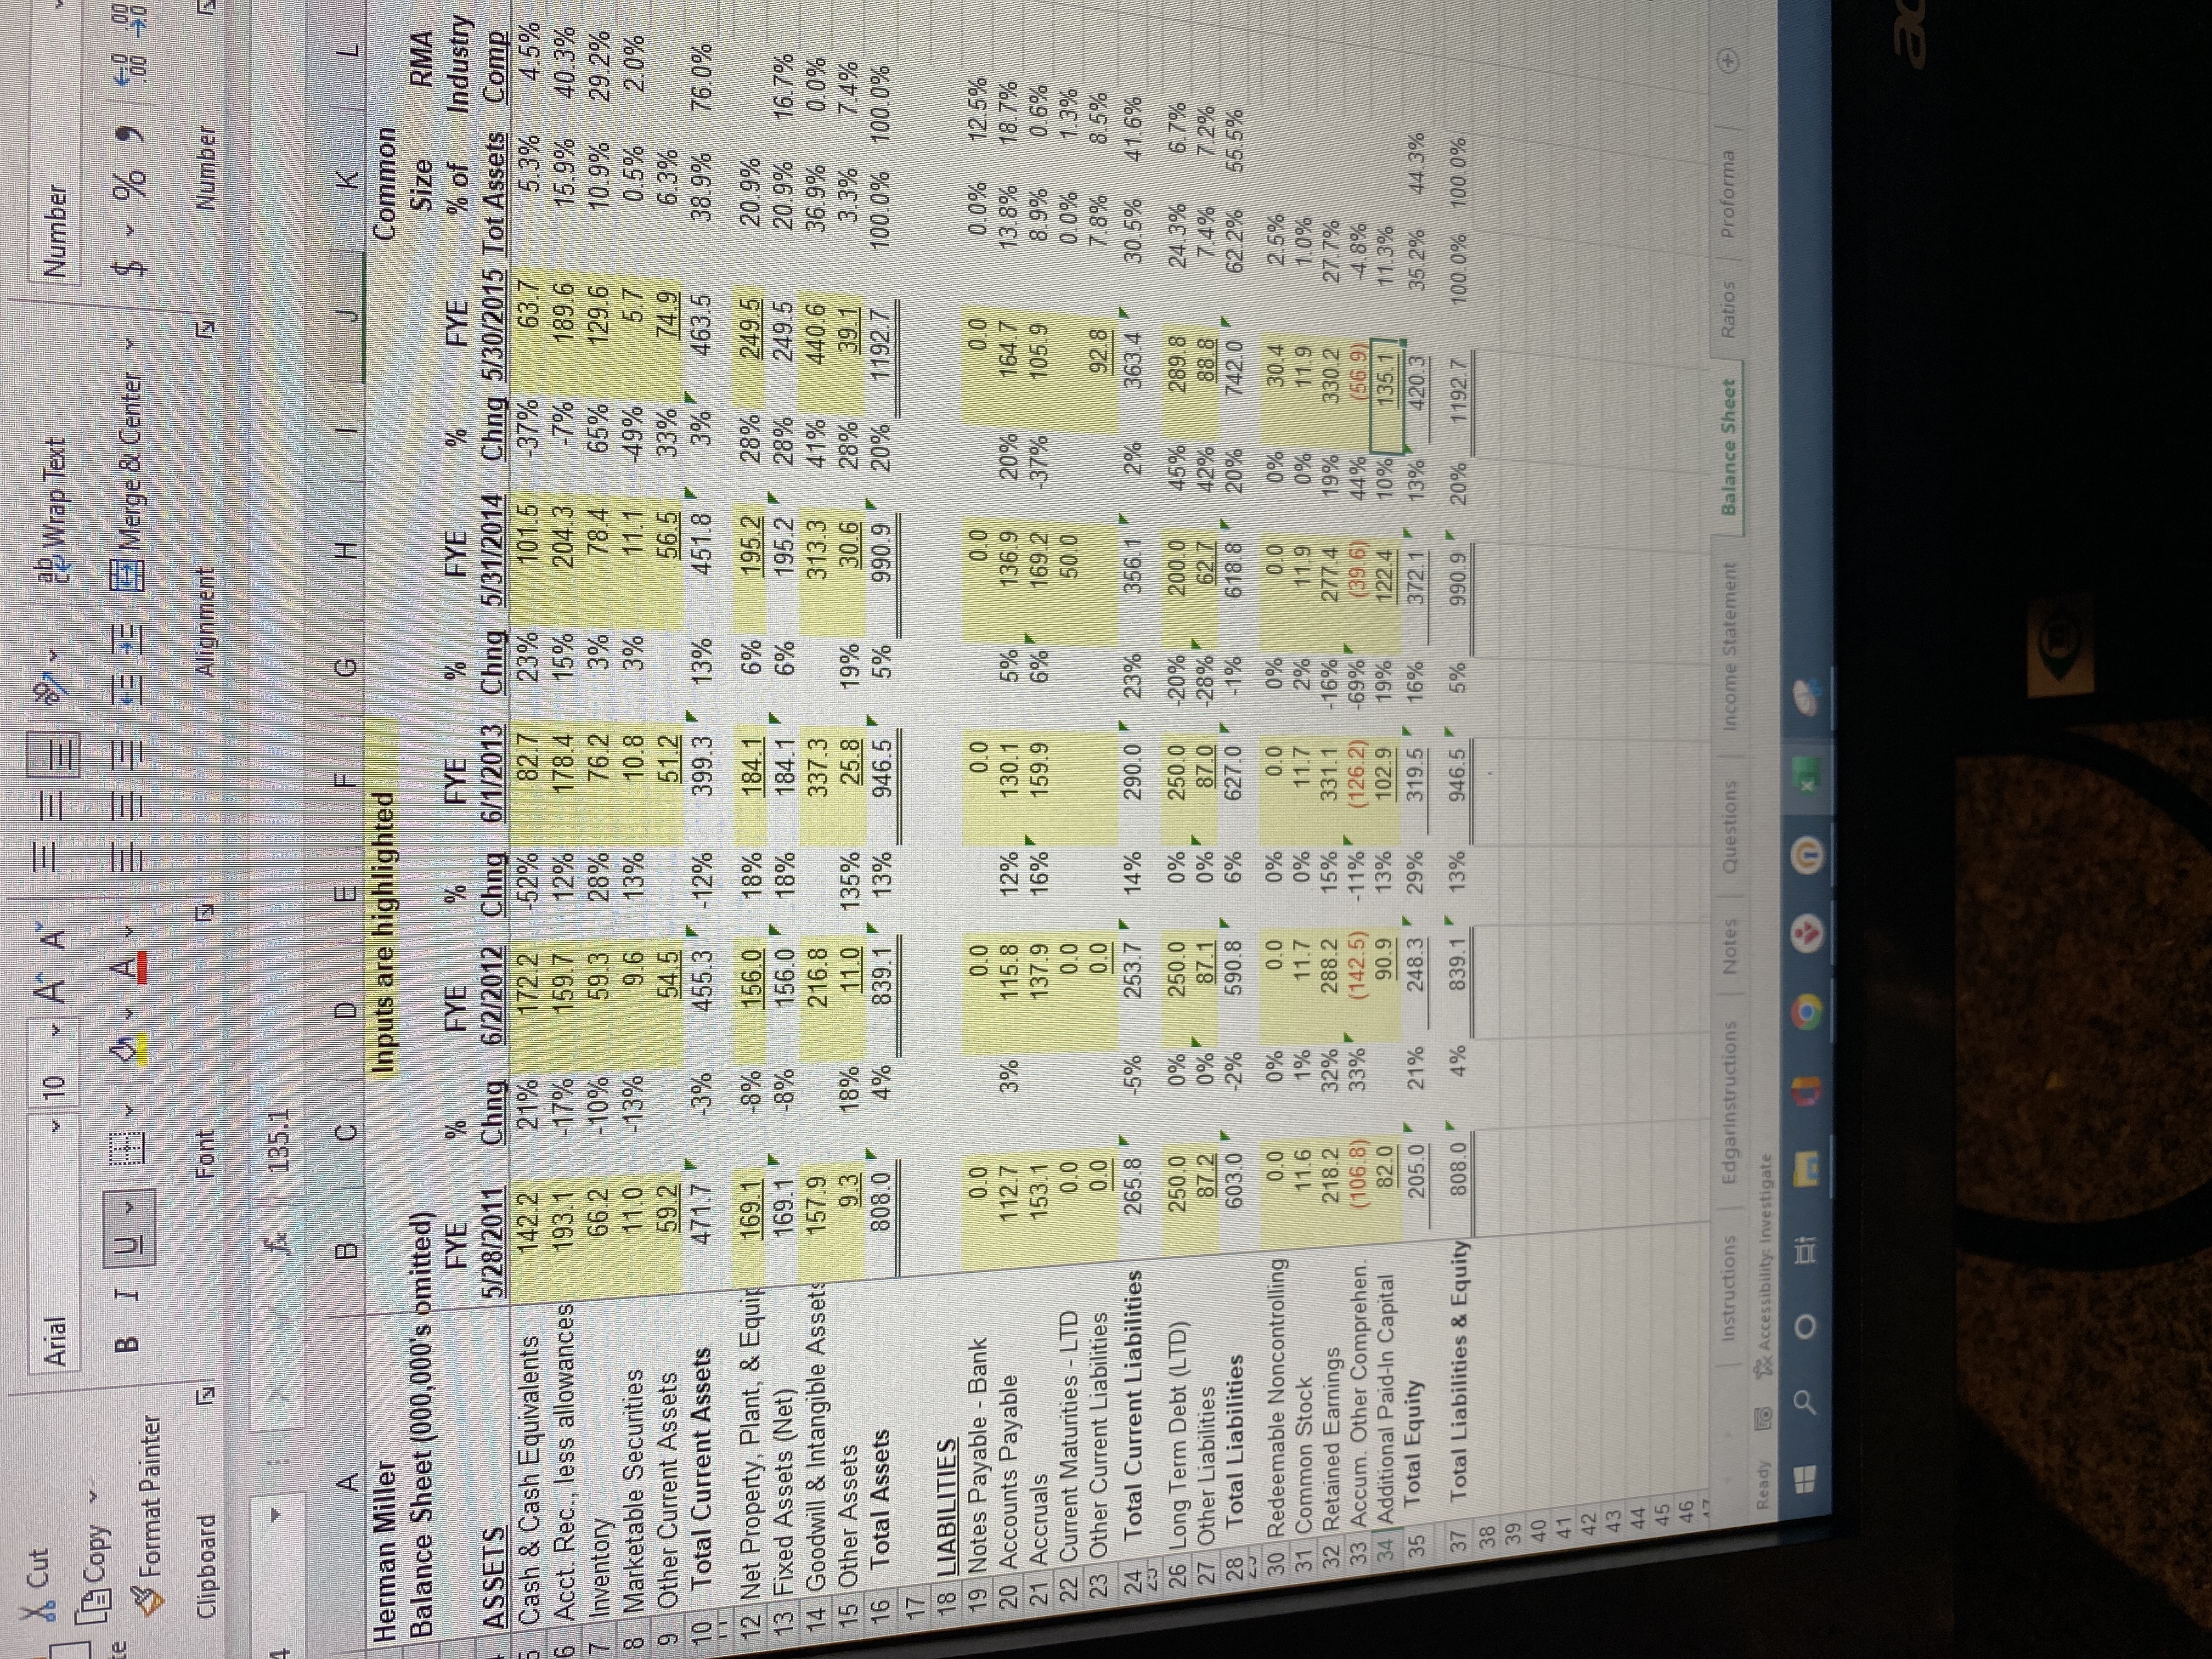
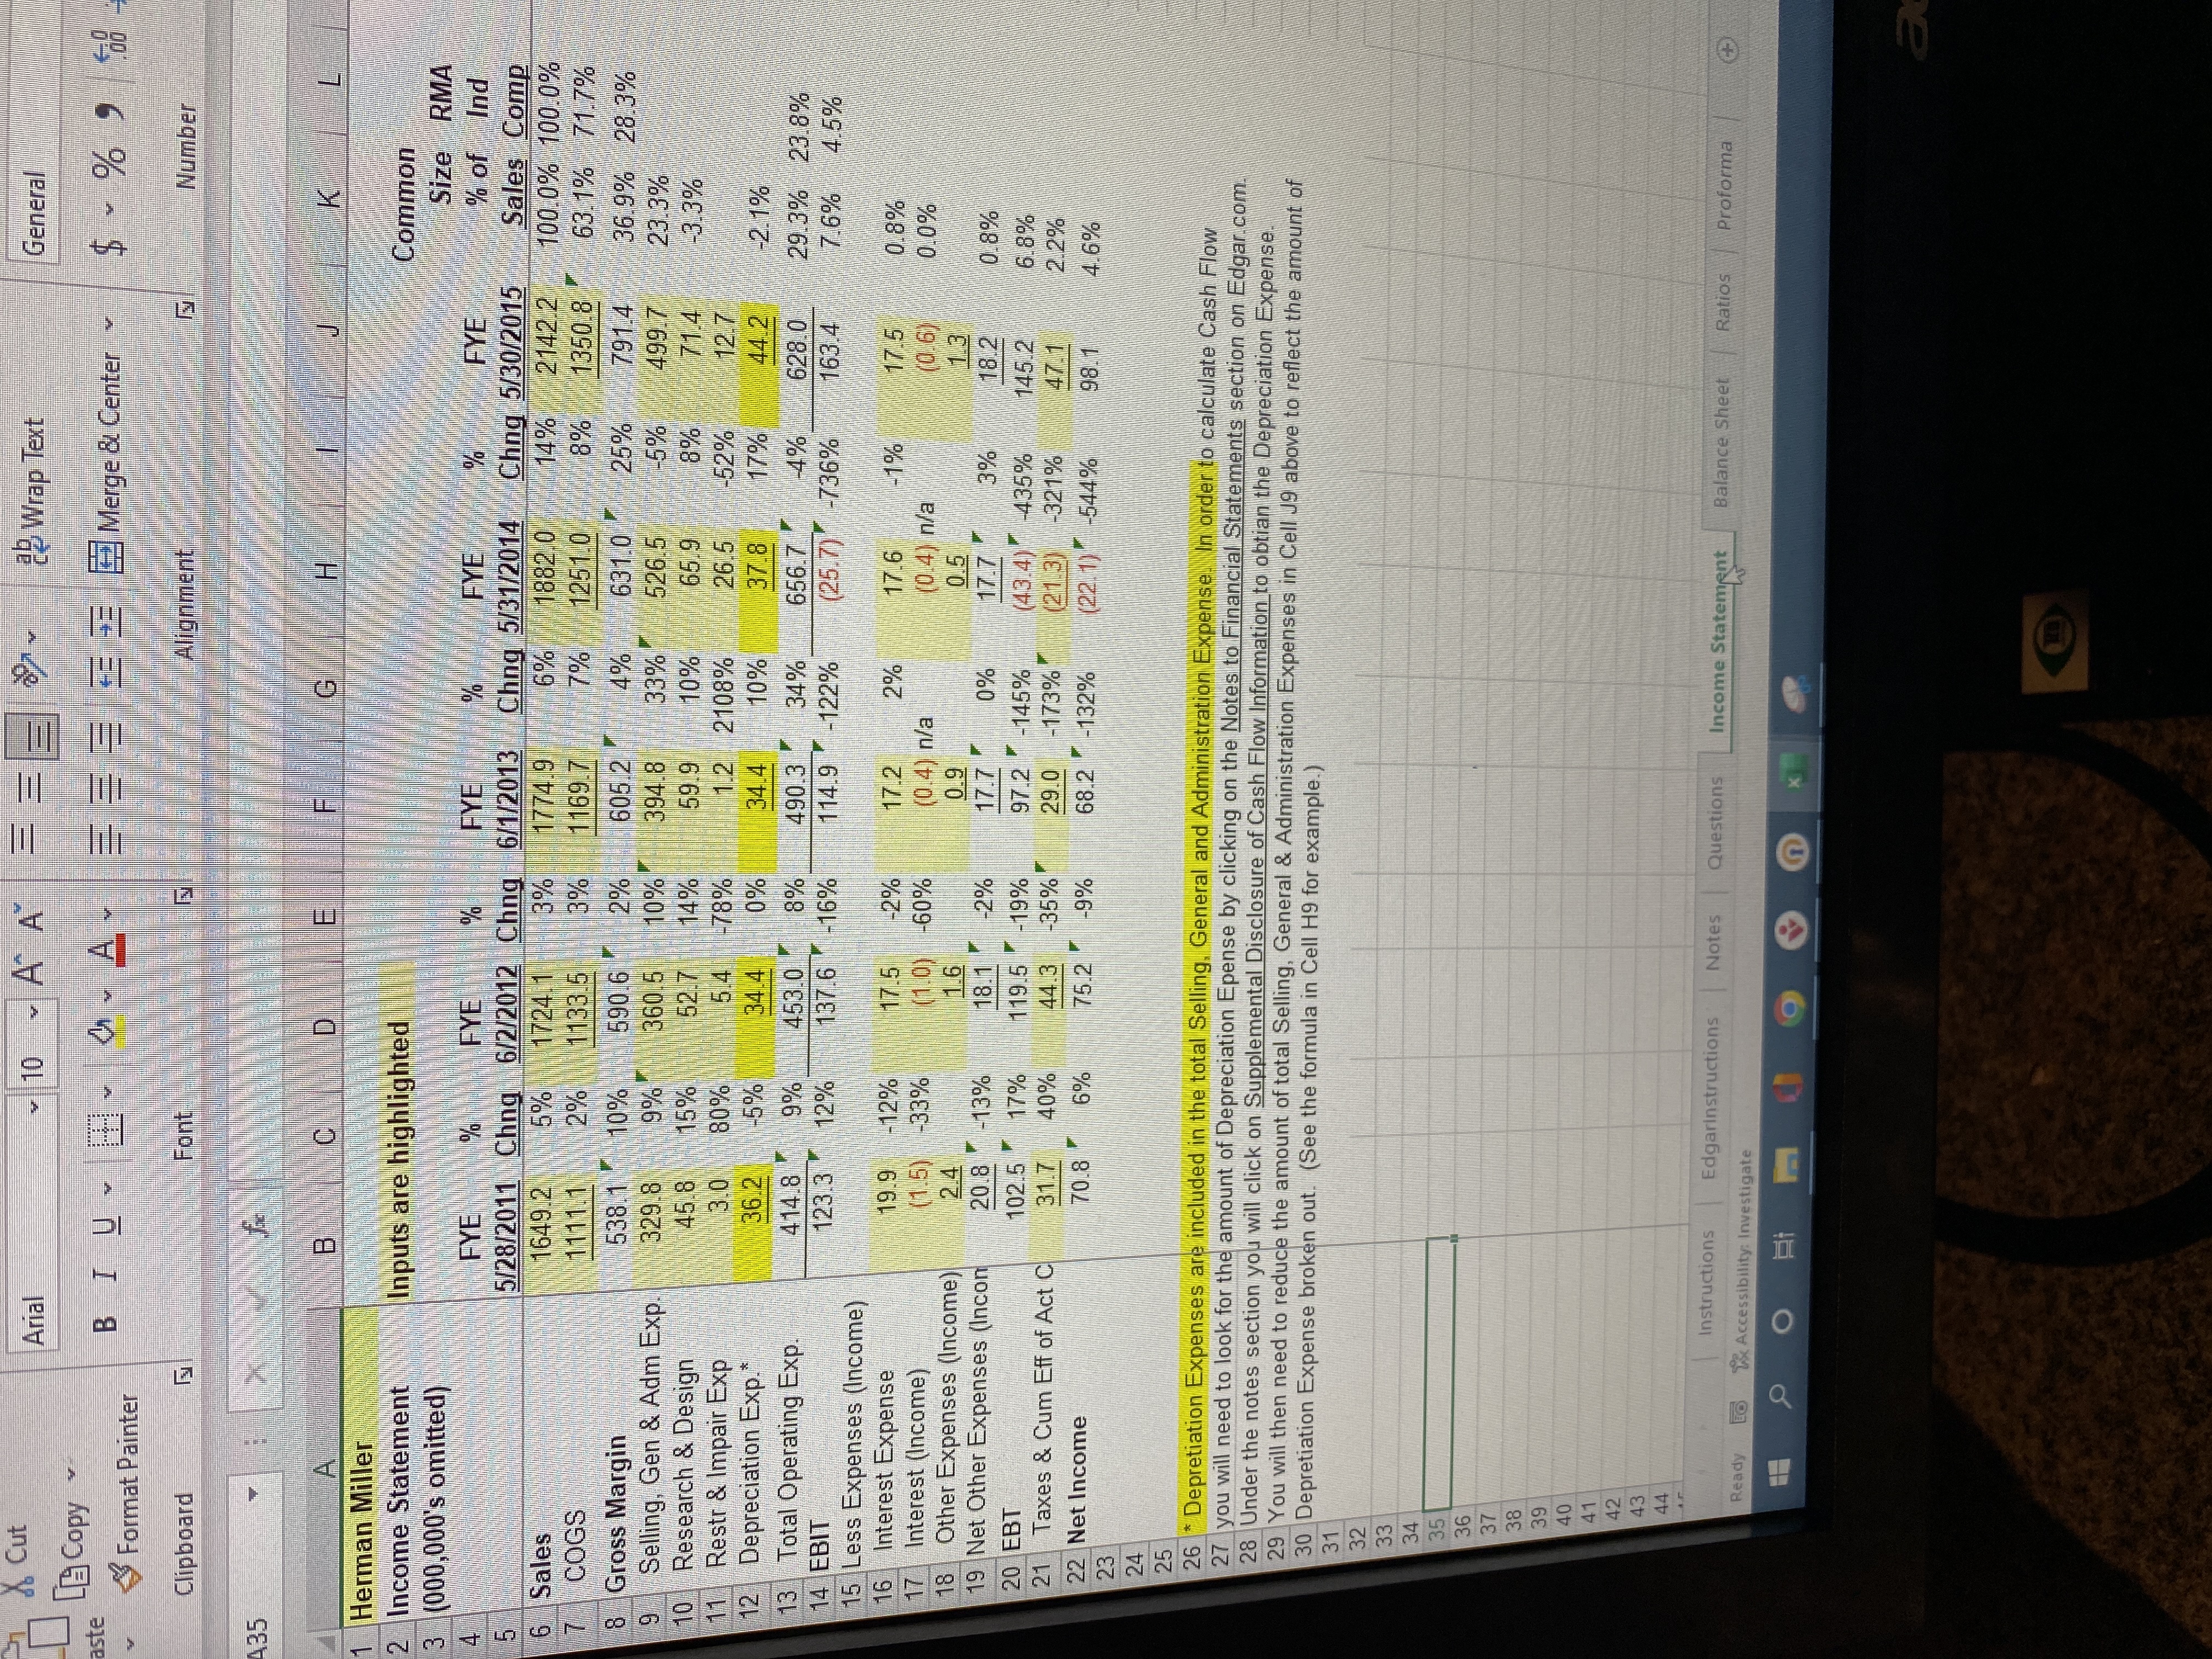
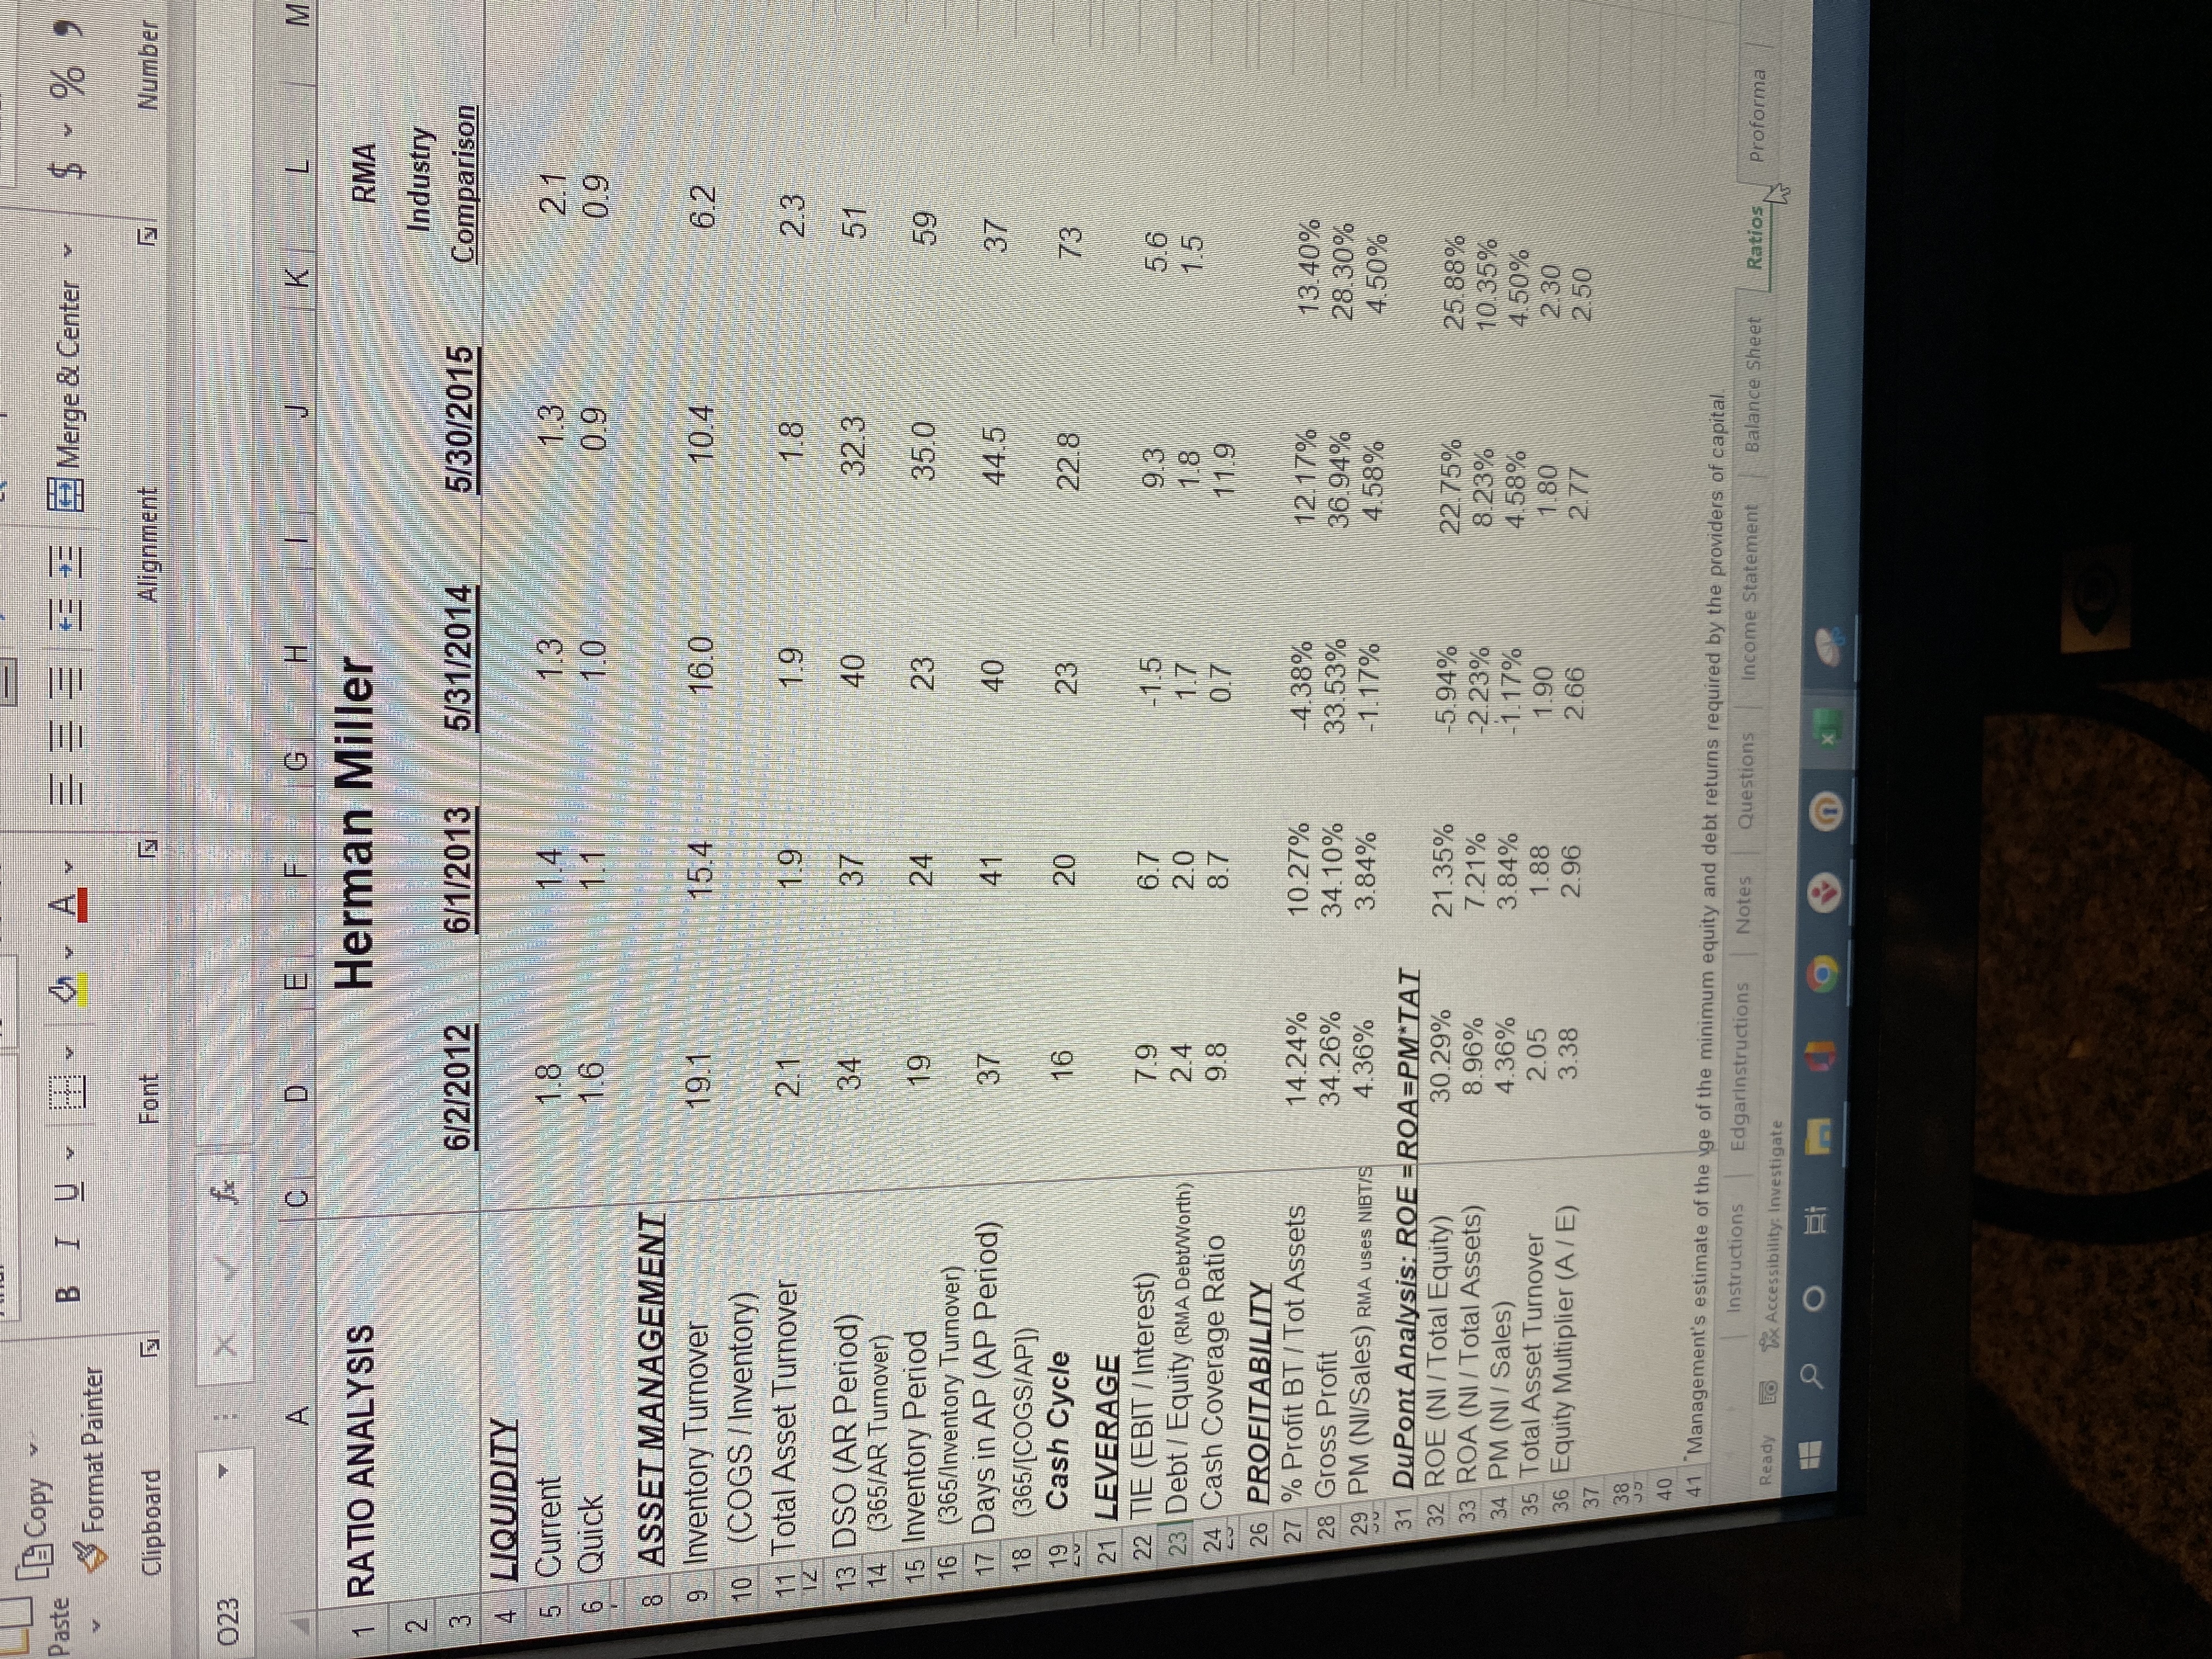
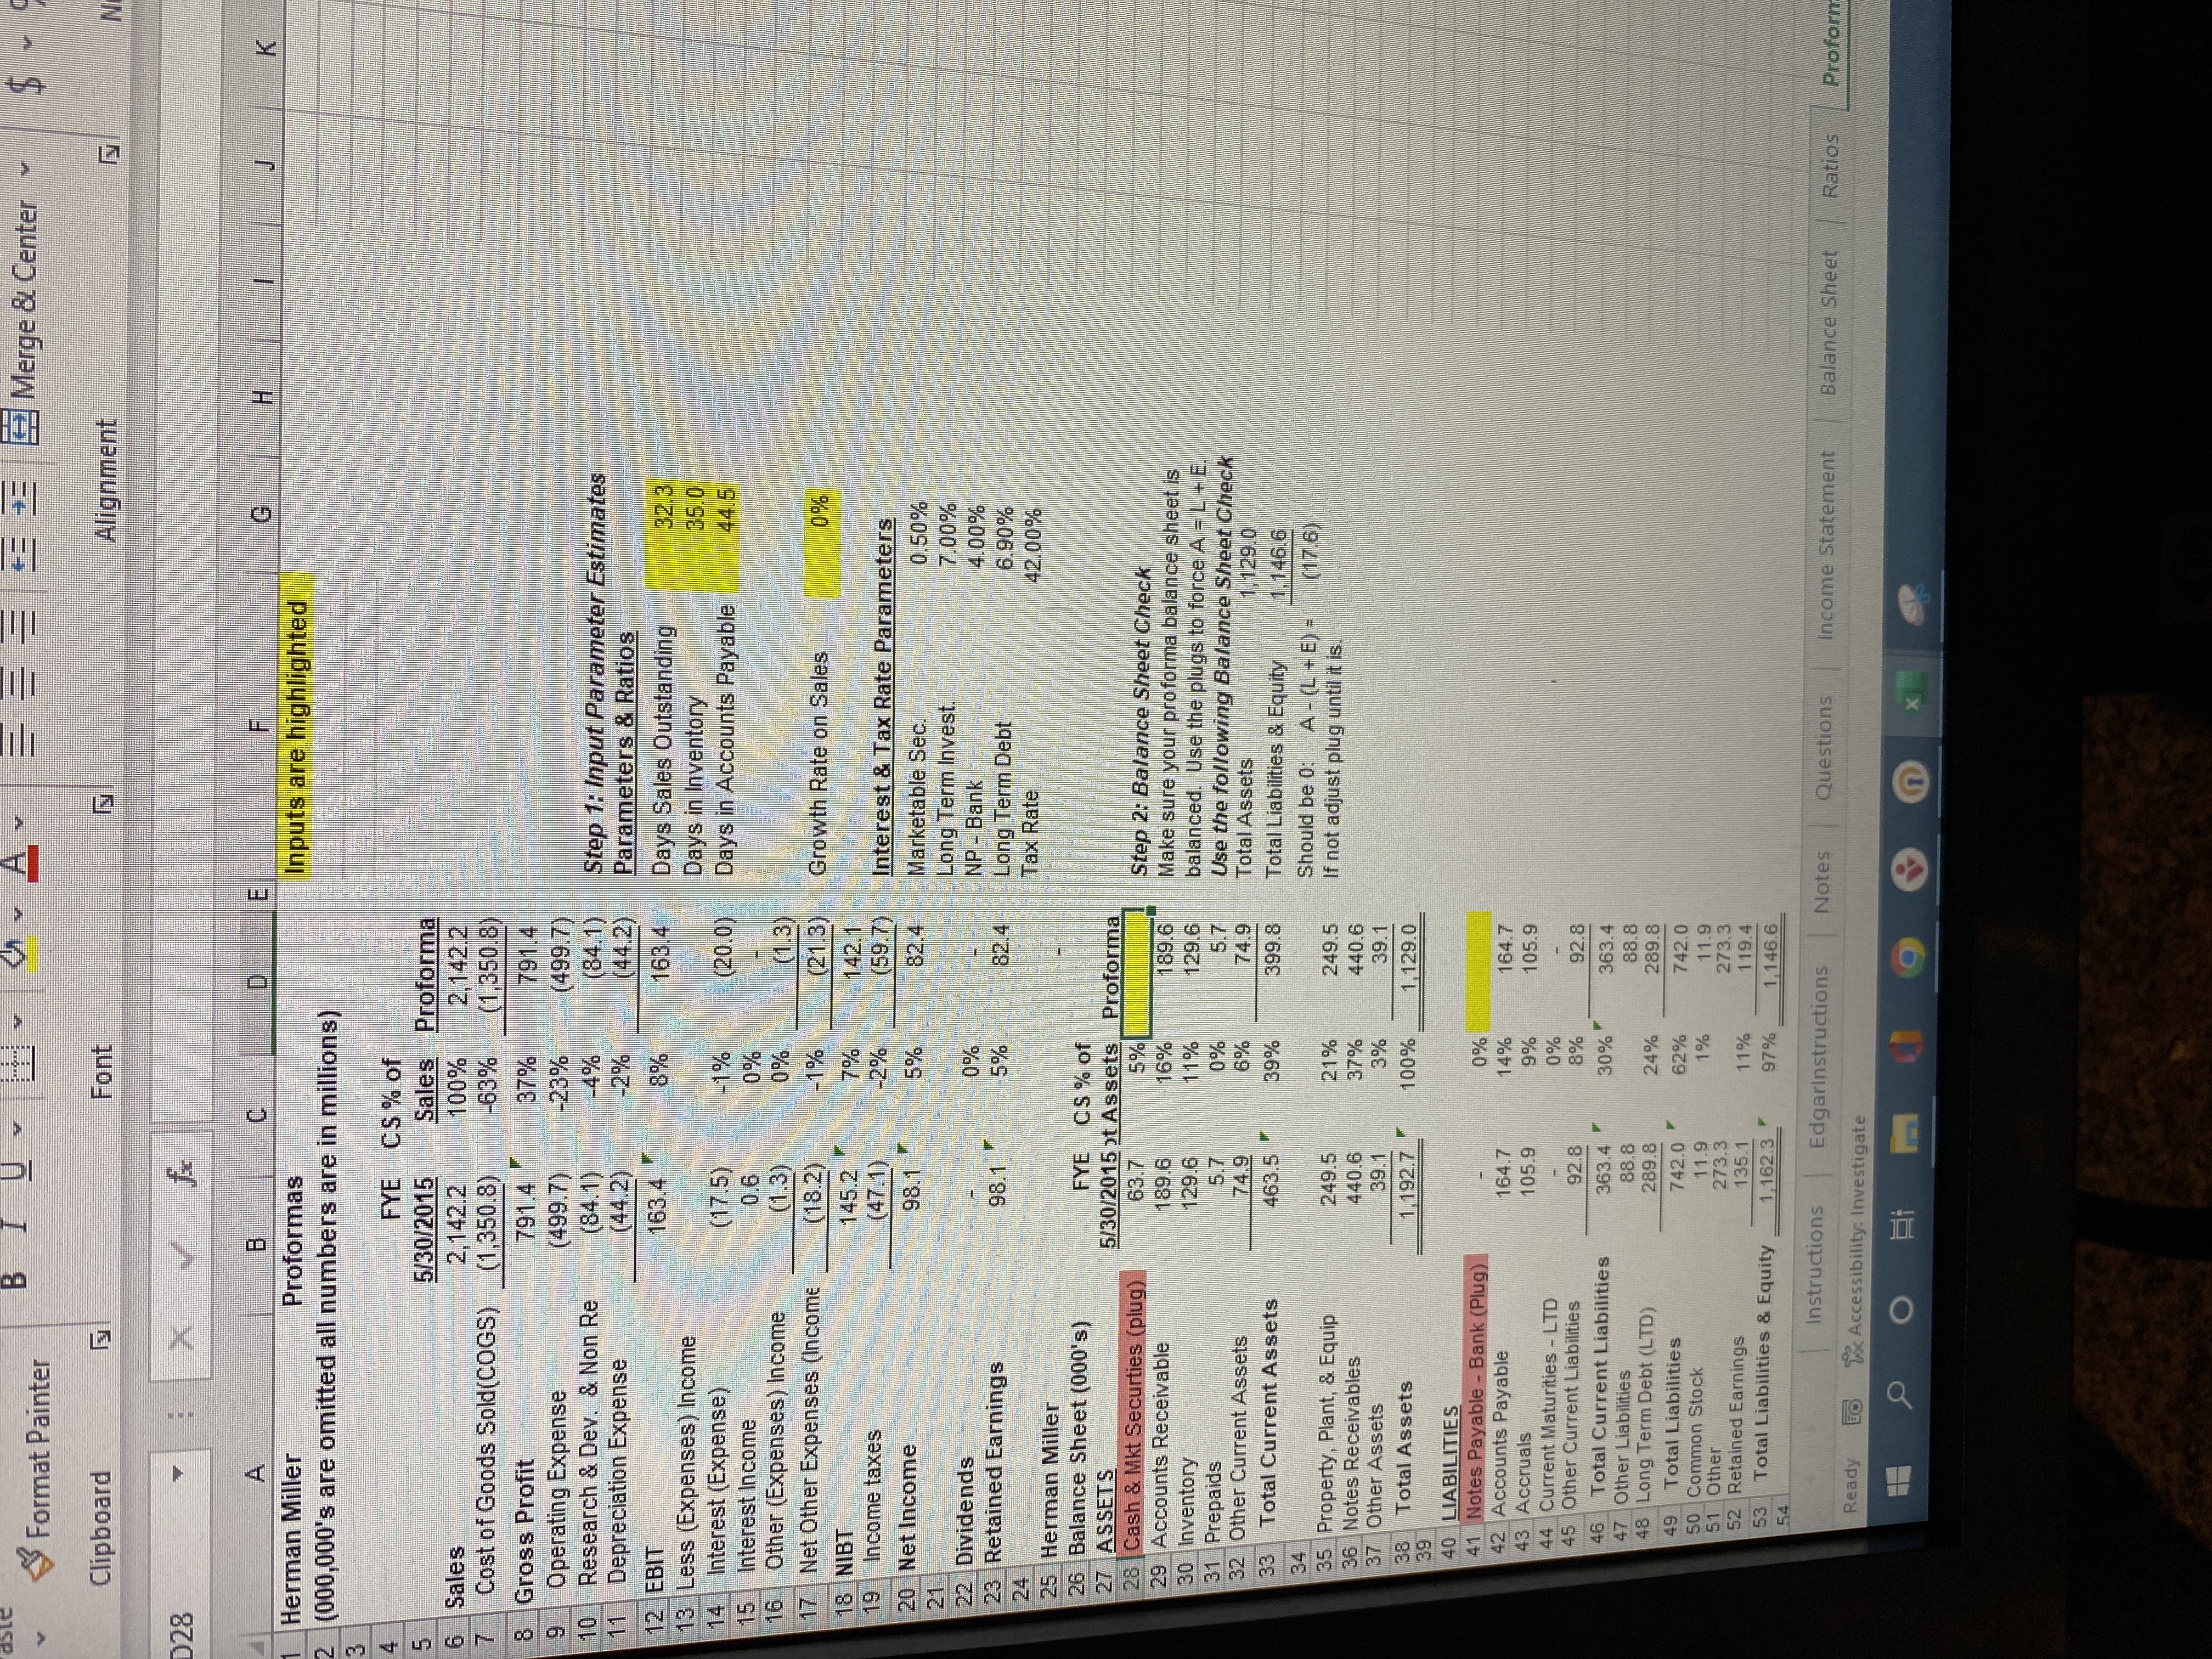
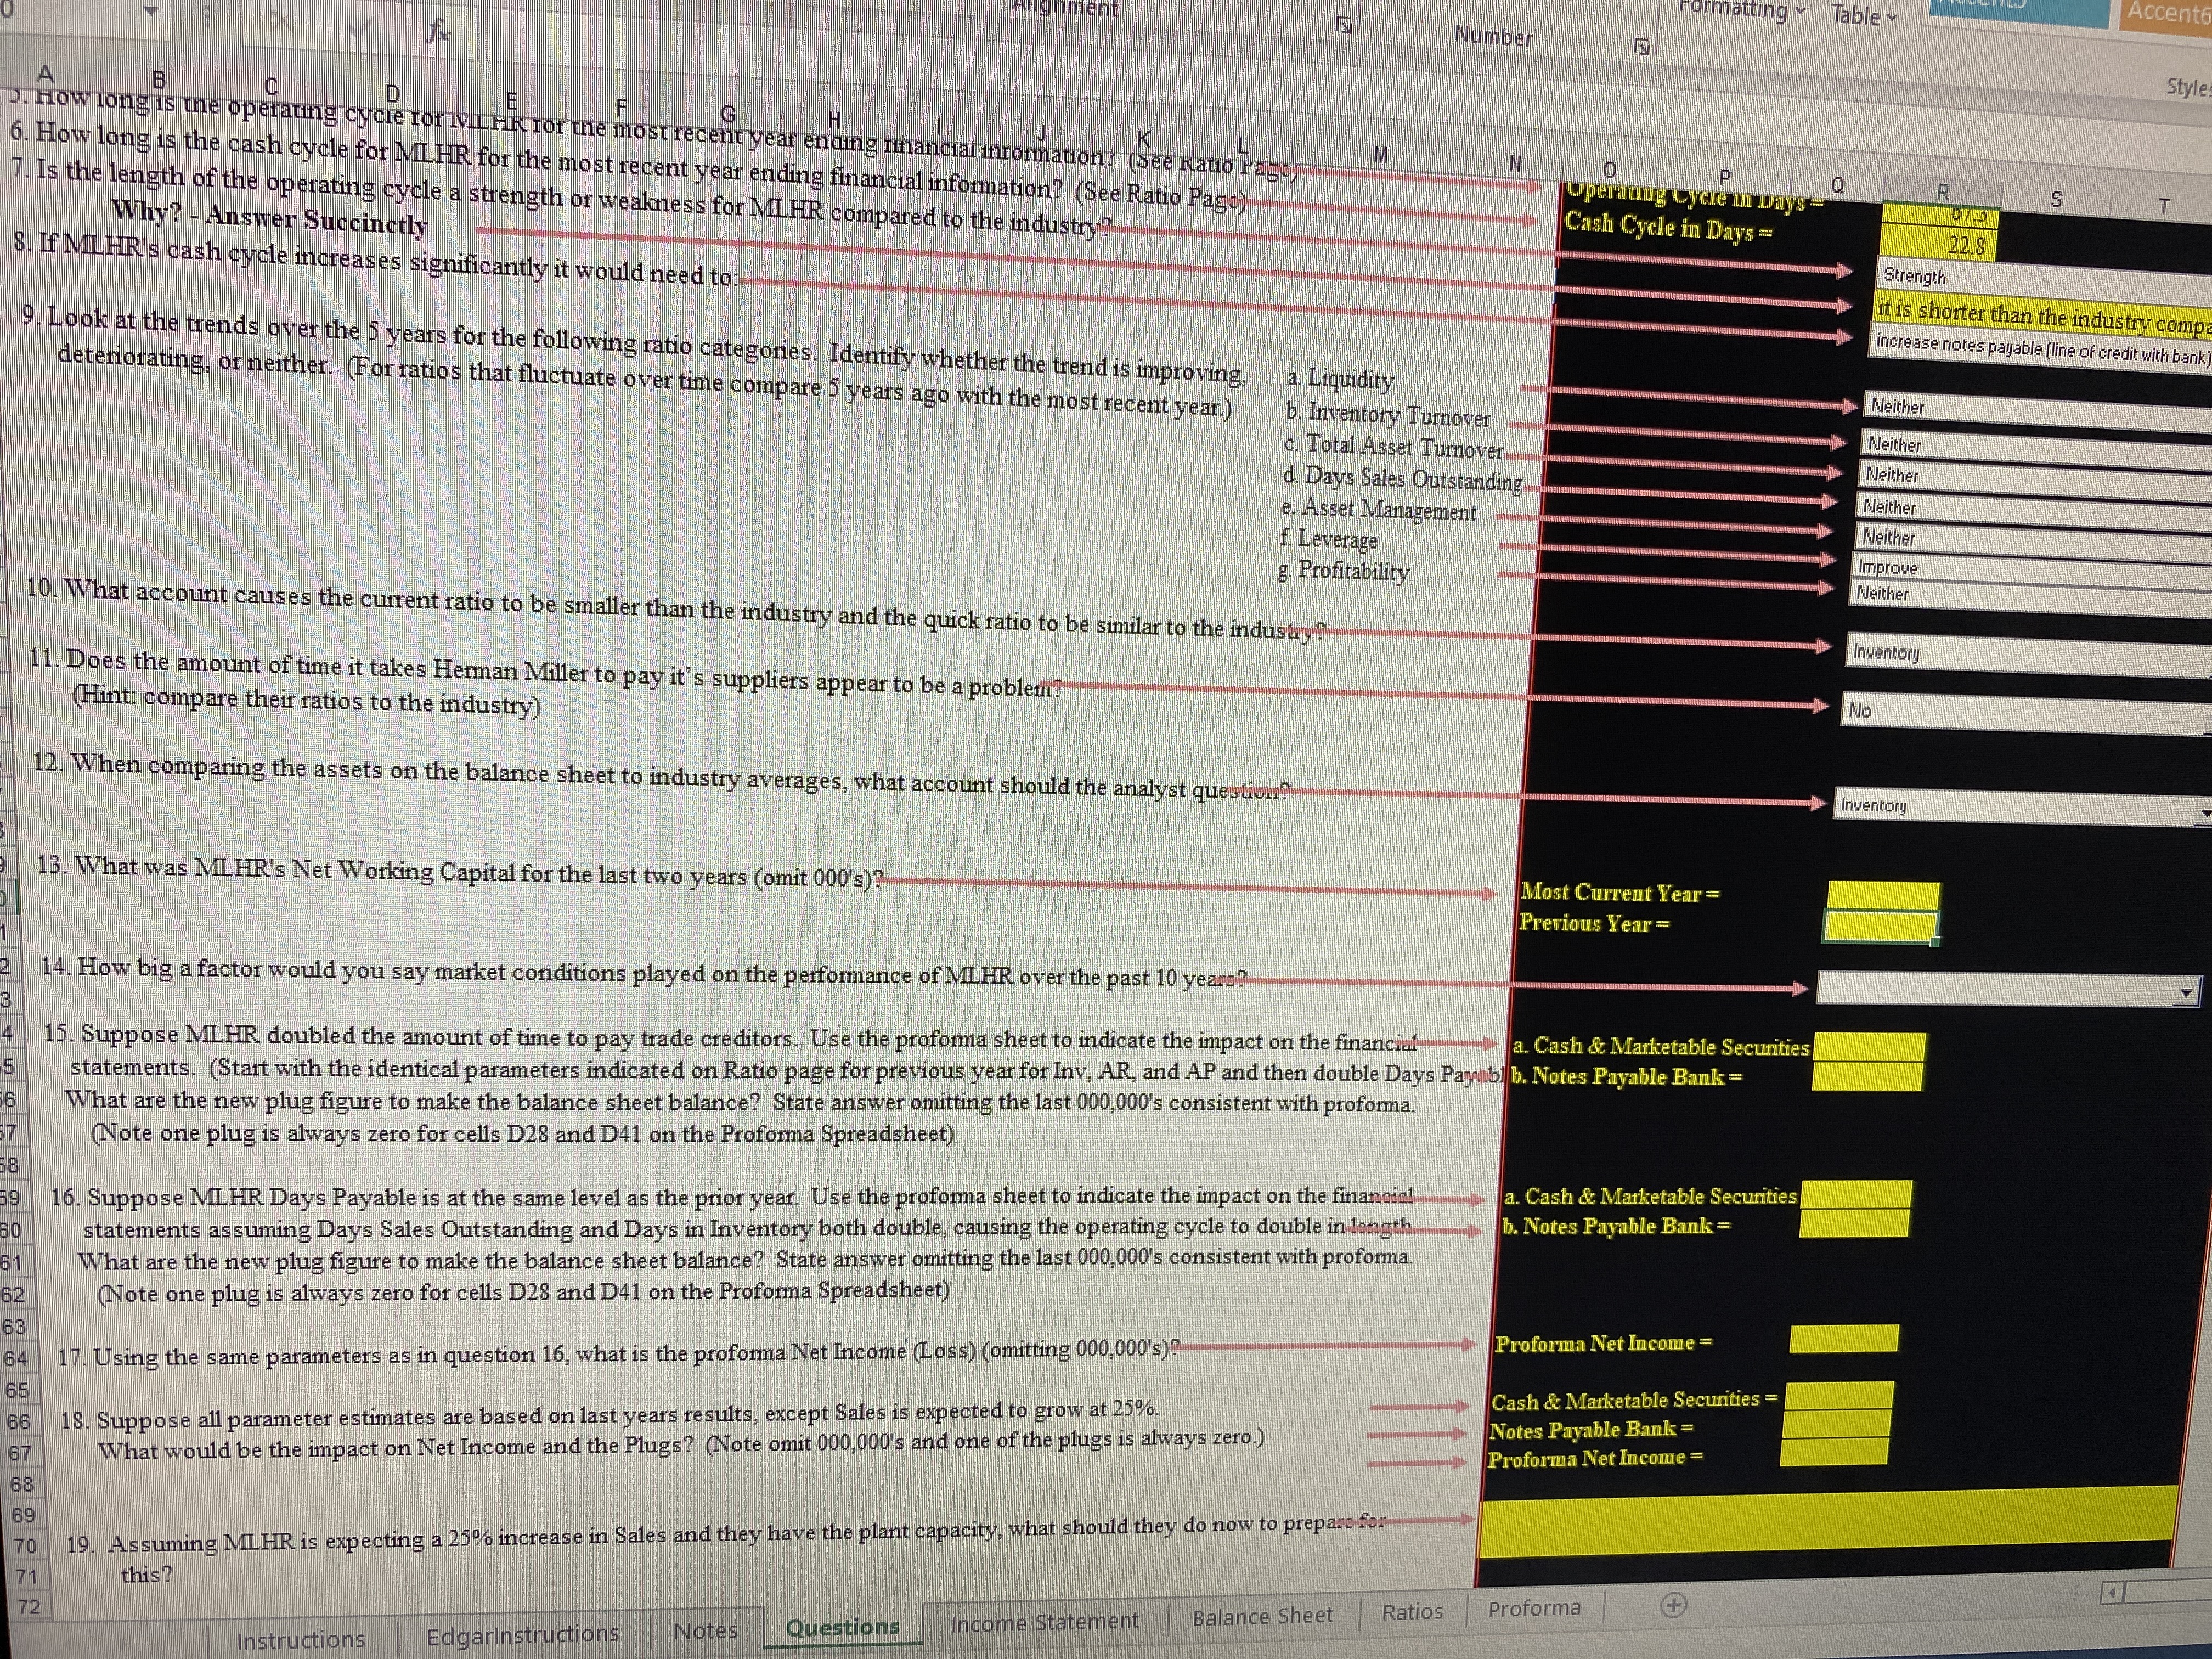
X Cut Arial ~ 10 -AA de Wrap Text Number LE Copy B U Merge & Center Format Painter Clipboard Alignment Number F Herman Miller Inputs are highlighted Common Balance Sheet (000,000's omitted) Size RMA FYE FYE % FYE % FYE % FYE % of Industry ASSETS 5/28/2011 Chng 6/2/2012 Chng 6/1/2013 Chng 5/31/2014 Chng 5/30/2015 Tot Assets Comp Cash & Cash Equivalents 142.2 21% 172 2 -52% 82 7 23% 101.5 -37% 63.7 5.3% 4.5% Acct. Rec., less allowances 193 1 17% 159 7 12% 178.4 15% 204 3 -7% 189 6 15 9% 40 3% 7 Inventory 66 2 10% 59 3 28% 76.2 3% 78.4 65% 129 6 10 9% 29.2% 8 Marketable Securities 110 3% 9.6 13% 10.8 3% 11.1 49% 5 7 0,5% 2.0% 9 Other Current Assets 59.2 54 5 51.2 56.5 33% 74.9 6.3% 10 Total Current Assets 471.7 455.3 -12% 399.3 13% 4518 3% 463.5 38 9% 76.0% 12 Net Property, Plant, & Equip 169.1 8% 156 0 18% 184.1 6% 195.2 28% 249 5 20.9% 13 Fixed Assets (Net) 169 1 .8% 156.0 18% 184.1 6% 195.2 28% 249 5 20.9% 16 7% 14 Goodwill & Intangible Assets 157.9 216.8 337.3 313.3 41% 440 6 36.9% 0 0% 15 Other Assets 9.3 18% 110 135% 25.8 19% 30.6 28% 39.1 3.3% 7.4% 16 Total Assets 808.0 4% 839.1 13% 946.5 5% 990.9 20% 1 192. 7 100 0% 100 0% 17 18 LIABILITIES 19 Notes Payable - Bank 0.0 0.0 0.0 0.0 0.0% 12 5% 20 Accounts Payable 112.7 3% 115.8 12% 130_1 136 9 20% 164 7 13 8% 18 7% 21 Accruals 153.1 137 9 16% 159.9 169.2 105 9 8.9% 0 6% 22 Current Maturities - LTD 0 0 0 0 50 0 0 0% 1.3% 23 Other Current Liabilities 0.0 0.0 92 8 7 8% 8.5% 24 Total Current Liabilities 265.8 7 -5% 253.7 14% 290 0 23% 356. 2% 363.4 30 5% 41.6% 26 Long Term Debt (LTD) 250.0 0% 250.0 0% 250.0 -20% 200 0 45 % 289 8 24 3% 6.7% 27 Other Liabilities 87 2 0% 87.1 87 0 -28% 62 7 42% 88 8 7.4% 7 2% 28 Total Liabilities 603.0 -2% 590.8 5% 627.0 -1% 518 8 20% 742. 62 2% 65 5% 30 Redeemable Noncontrolling 0.0 0% 0.0 0% 0.0 0% 0% 30 2.5% 31 Common Stock 116 1% 11.7 0% 11.7 2% 119 0% 119 1.0% 32 Retained Earnings 218.2 32% 288.2 15% 331.1 -16% 277.4 19% 330. 2 27 7% 33 Accum. Other Comprehen 106 8) 33% (142.5) -11% (126.2) -69% (39.6) 14% (56.9) 4.8% 34 Additional Paid-In Capital 82.0 90.9 13% 102.9 19% 122 4 10% 135.1 11.3%% 35 Total Equity 205.0 21% 248.3 29% 319.5 16% 372.1 13% 4203 35 2% 44 3% 37 Total Liabilities & Equity 808.0 4% 839.1 13% 946.57 5% 990 97 20% 11927 100 0% 100 0% 38 39 40 41 42 43 44 45 46 Instructions Edgarinstructions Notes Questions Income Statement Balance Sheet Ratios Proforma Ready 1x Accessibility: Investigate O 9 XA Cut Arial 10 AA 29 Wrap Text General Copy ste B I U - CE E Merge & Center ~ $ ~ % " Format Painter Clipboard Font Alignment Number 35 B C D G K Herman Miller 2 Income Statement Inputs are highlighted Common (000,000's omitted) Size RMA FYE % FYE % FYE FYE FYE of Ind 5 5/28/2011 Chng 6/2/2012 Chng 6/1/2013 Chng 5/31/2014 Chng 5/30/2015 Sales Comp 6 Sales 1649 2 5% 1724 1 3% 1774.9 6% 1882 0 14% 2142 2 100 0% 100.0% COGS 1111.1 2% 133_ 3% 1 169 7 7% 1251.0 8% 1350 8 63 1% 71 7% 8 Gross Margin 538 1 10% 590.6 2% 605 2 4% 6310 25% 791 4 36 9% 28 3% 9 Selling, Gen & Adm Exp 329.8 9% 360 5 10% 394.8 33% 526.5 -5% 499.7 23 3% 10 Research & Design 45.8 15% 52 7 14% 59.9 10% 65.9 8% 71.4 -3.3% 11 Restr & Impair Exp 3.0 80% 54 -78% 1.2 2108% 26.5 -52% 12.7 12 Depreciation Exp.* 36 2 -5% 34.4 0% 34.4 10% 37 8 17% 44 2 2 1% 13 Total Operating Exp 4148 9% 453.0 8% 490.3 34% 656.7 4% 628.0 29.3% 23.8% 14 EBIT 123 3 12% 137.6 -16% 114.9 -122% (25. 736% 163 4 7 6% 4.5% 15 Less Expenses (Income 16 Interest Expense 19.9 -12% 17.5 -2% 17.2 2% 17 6 17 5 0.8% 17 Interest (Income) (1.5) -33% (1.0) 60% (0.4) n/a (0 4) n/a (0 6) 0.0% 18 Other Expenses (Income) 2.4 1.6 0.9 0.5 13 19 Net Other Expenses (Incon 20 8 -13% 18-1 -2% 17.7 0% 17 7 3 % 18 2 0.8% 20 EBT 02.5 17% 119 5 -19% 97.2 -145% 43.4)-435% 145.2 6.8% 21 Taxes & Cum Eff of Act C 31 7 40% -35% -173% 21 3) -321% 47 1 2.2% 22 Net Income 708 6% 75.2 -9% 68.2 -132% -544% 98 1 4.6% 23 24 25 26 " Depretiation Expenses are included in the total Selling, General and Administration Expense. In order to calculate Cash Flow 27 you will need to look for the amount of Depreciation Epense by clicking on the Notes to Financial Statements section on Edgar.com 28 Under the notes section you will click on Supplemental Disclosure of Cash Flow Information to obtian the Depreciation Expense. 29 You will then need to reduce the amount of total Selling, General & Administration Expenses in Cell J9 above to reflect the amount of 30 Depretiation Expense broken out. (See the formula in Cell H9 for example.) 31 32 33 34 35 36 37 38 39 40 41 42 43 44 Instructions Edgarinstructions Notes Questions Income Statement Balance Sheet Ratios Proforma Ready to % Accessibility: Investigate O d9 X[ Copy Paste BIU U - A CE E Merge & Center Format Painter Clipboard Font Alignment Number 023 D H RATIO ANALYSIS Herman Miller RMA Industry 3 6/2/2012 6/1/2013 5/31/2014 5/30/2015 Comparison 4 LIQUIDITY 5 Current 1.8 1.4 13 2.1 6 Quick 16 1.0 09 09 8 ASSET MANAGEMENT 9 Inventory Turnover 19 1 15 4 16.0 10 4 6.2 10 (COGS / Inventory) 11 Total Asset Turnover 1.9 18 23 12 13 DSO (AR Period) 34 37 40 32 3 51 14 (365/AR Turnover) 15 Inventory Period 24 23 35.0 59 16 (365/Inventory Turnover) 17 Days in AP (AP Period) 37 41 40 44.5 37 18 (365/[COGS/AP]) 19 Cash Cycle 16 20 23 22 8 73 21 LEVERAGE 22 TIE (EBIT / Interest) 79 6.7 -1.5 93 5.6 23 Debt / Equity (RMA Debt/Worth) 2.4 2.0 1.7 18 15 24 Cash Coverage Ratio 9.8 87 0.7 11 9 26 PROFITABILITY 27 % Profit BT / Tot Assets 14.24% 10.27% 4.38% 12 17% 13.40% 28 Gross Profit 34.26% 34.10% 33.53% 36 94% 28.30% 29 PM (NI/Sales) RMA uses NIBTIS 4.36% 3.84% -1 17% 4 58% 4 50% 31 DuPont Analysis: ROE =ROA=PM*TAT 32 ROE (NI / Total Equity) 30.29% 21.35% 5.94% 22 75% 25 88% 33 ROA (NI / Total Assets) 8.96% 7.21% 2.23% 8.23% 10 35% 34 PM (NI / Sales) 4.36% 3.84% 1 17% 4.58% 4.50% 35 Total Asset Turnover 2.05 1.88 1.90 1.80 36 Equity Multiplier (A / E) 2.30 3.38 2.96 2.66 2.50 37 2.77 38 40 41 Management's estimate of the ige of the minimum equity and debt returns required by the providers of capital Instructions Edgarinstructions Notes Questions Income Statement Balance Sheet Ratios Proforma Ready to 5 x Accessibility: Investigate O X#23 Merge & Center Format Painter Clipboard Font Alignment 28 A D G Herman Miller Proformas Inputs are highlighted (000,000's are omitted all numbers are in millions) FYE CS % of 5/30/2015 Sales Proforma 6 Sales 2,142.2 100% 2,142.2 7 Cost of Goods Sold(COGS) (1,350.8) -63% (1,350.8) 8 Gross Profit 791.4 37% 791.4 9 Operating Expense (499.7) 23% (499.7) 10 Research & Dev. & Non Re (84.1) 4% (84.1) Step 1: Input Parameter Estimates 11 Depreciation Expense (44.2) -2% (44.2) Parameters & Ratios 12 EBIT 163.4 8% 163.4 Days Sales Outstanding 32. 3 13 Less (Expenses) Income Days in Inventory 35.0 14 Interest (Expense) (17.5 1% (20.0) Days in Accounts Payable 44.5 15 Interest Income 0.6 0% 16 Other (Expenses) Income (1.3 0% 1.3 17 Net Other Expenses (Income (18.2) -1% (21.3) Growth Rate on Sales 0% 8 NIBT 145.2 7% 42. Income taxes 47.1 -2% (59.7) Interest & Tax Rate Parameters 20 Net Income 98.1 5% 824 Marketable Sec. 0.50% 21 Long Term Invest. 7.00% 22 Dividends 0% NP - Bank 4.00% 23 Retained Earnings 50% 82 Long Term Debt 6,90% 24 Tax Rate 42.00% 25 Herman Miller 26 Balance Sheet (000's) FYE CS % of 27 ASSETS 5/30/2015 at Assets Proforma 28 Cash & Mkt Securties (plug) 63. 5%1 Step 2: Balance Sheet Check 29 Accounts Receivable 189.6 16% 189.6 Make sure your proforma balance sheet is 30 Inventory 29.6 11% 29.6 balanced. Use the plugs to force A = L - E. 31 Prepaids 5.7 0% 5.7 Use the following Balance Sheet Check 32 Other Current Assets 74.9 6% 74.9 Total Assets 1.129.0 33 Total Current Assets 63.5 39% 399.8 Total Liabilities & Equity 1.146.6 34 Should be 0: A - (L - E) - (176 35 Property, Plant, & Equip 249.5 21% 249.5 If not adjust plug until it is. 36 Notes Receivables 440.6 37% 140.6 37 Other Assets 39.1 3% 39.1 38 Total Assets 1.192.7 100% 1,129.0 39 40 LIABILITIES 41 Notes Payable - Bank (Plug) 0% 42 Accounts Payable 164.7 14% 164.7 43 Accruals 105.9 9% 105.9 44 Current Maturities - LTD 0% 45 Other Current Liabilities 92.8 8% 92.8 46 Total Current Liabilities 363.4 30% 363.4 47 Other Liabilities 38.8 88.8 48 Long Term Debt (LTD) 289.8 24% 289.8 49 Total Liabilities 742.0 62% 742.0 50 Common Stock 11.9 1% 11.9 51 Other 273.3 273.3 52 Retained Earnings 135.1 1 1% 119.4 53 Total Liabilities & Equity 1,162.3 97% 1,146.6 54 Instructions Edgarinstructions Notes Questions Income Statement Balance Sheet Ratios Proform Ready to 1x Accessibility: Investigate O 9 1 Xormatting Table - Accent A Styl p. how long is the operating cycle for ME.rik for the most recent year ending financial inronnation ? (see kauo rage 6. How long is the cash cycle for MLHR for the most recent year ending financial information? (See Ratio Pago).) operating Cycle in Days Q 7.Is the length of the operating cycle a strength or weakness for MIHR compared to the industry?. T Why? - Answer Succinctly Cash Cycle in Days = 22.8 S. If MLHR's cash cycle increases significantly it would need to Strength it is shorter than the industry com 9. Look at the trends over the 5 years for the following ratio categories. Identify whether the trend is improving. increase notes payable (line of credit with bank deteriorating, or neither. (For ratios that fluctuate over time compare 5 years ago with the most recent year.) a. Liquidity b. Inventory Turnover Neither Total Asset Turnover Neither d Days Sales Outstanding Neither . Asset Management Neither f. Leverage Neither . Profitability Improve Neither 10. What account causes the current ratio to be smaller than the industry and the quick ratio to be similar to the industry Inventory 11. Does the amount of time it takes Herman Miller to pay it's suppliers appear to be a problem?" (Hint: compare their ratios to the industry) No 12. When comparing the assets on the balance sheet to industry averages, what account should the analyst quest nventory 13. What was MLHR's Net Working Capital for the last two years (omit 000's)? Most Current Year= Previous Year = 14. How big a factor would you say market conditions played on the performance of MLHR over the past 10 years? 15. Suppose MLHR doubled the amount of time to pay trade creditors. Use the proforma sheet to indicate the impact on the financial a. Cash & Marketable Securities statements. (Start with the identical parameters indicated on Ratio page for previous year for Inv, AR, and AP and then double Days Payubl b. Notes Payable Bank = What are the new plug figure to make the balance sheet balance? State answer omitting the last 000,000's consistent with proforma. (Note one plug is always zero for cells D28 and D41 on the Proforma Spreadsheet) 16. Suppose MIHR Days Payable is at the same level as the prior year. Use the proforma sheet to indicate the impact on the financial a. Cash & Marketable Securities statements assuming Days Sales Outstanding and Days in Inventory both double, causing the operating cycle to double in length. b. Notes Payable Bank = What are the new plug figure to make the balance sheet balance? State answer omitting the last 000,000's consistent with proforma. 62 (Note one plug is always zero for cells D28 and D41 on the Proforma Spreadsheet) Proforma Net Income = 64 17. Using the same parameters as in question 16, what is the proforma Net Income (Loss) (omitting 000,000's)? 65 Cash & Marketable Securities 66 18. Suppose all parameter estimates are based on last years results, except Sales is expected to grow at 25%. Notes Payable Bank = 67 What would be the impact on Net Income and the Plugs? (Note omit 000,000's and one of the plugs is always zero.) Proforma Net Income = 68 69 the plant capacity, what should they do now to prepare for 70 19. Assuming MLHR is ex 71 this 72 Ratios + Notes Income Statement Instructions Questions Balance Sheet Proforma Edgarinstructions
Step by Step Solution
There are 3 Steps involved in it
1 Expert Approved Answer
Step: 1 Unlock
Question Has Been Solved by an Expert!
Get step-by-step solutions from verified subject matter experts
Step: 2 Unlock
Step: 3 Unlock
Students Have Also Explored These Related Finance Questions!