

Question: X Data set Print Done (a) Draw a scatter diagram of the data. Choose the correct graph below. O A. OB. O c. OD. 10-
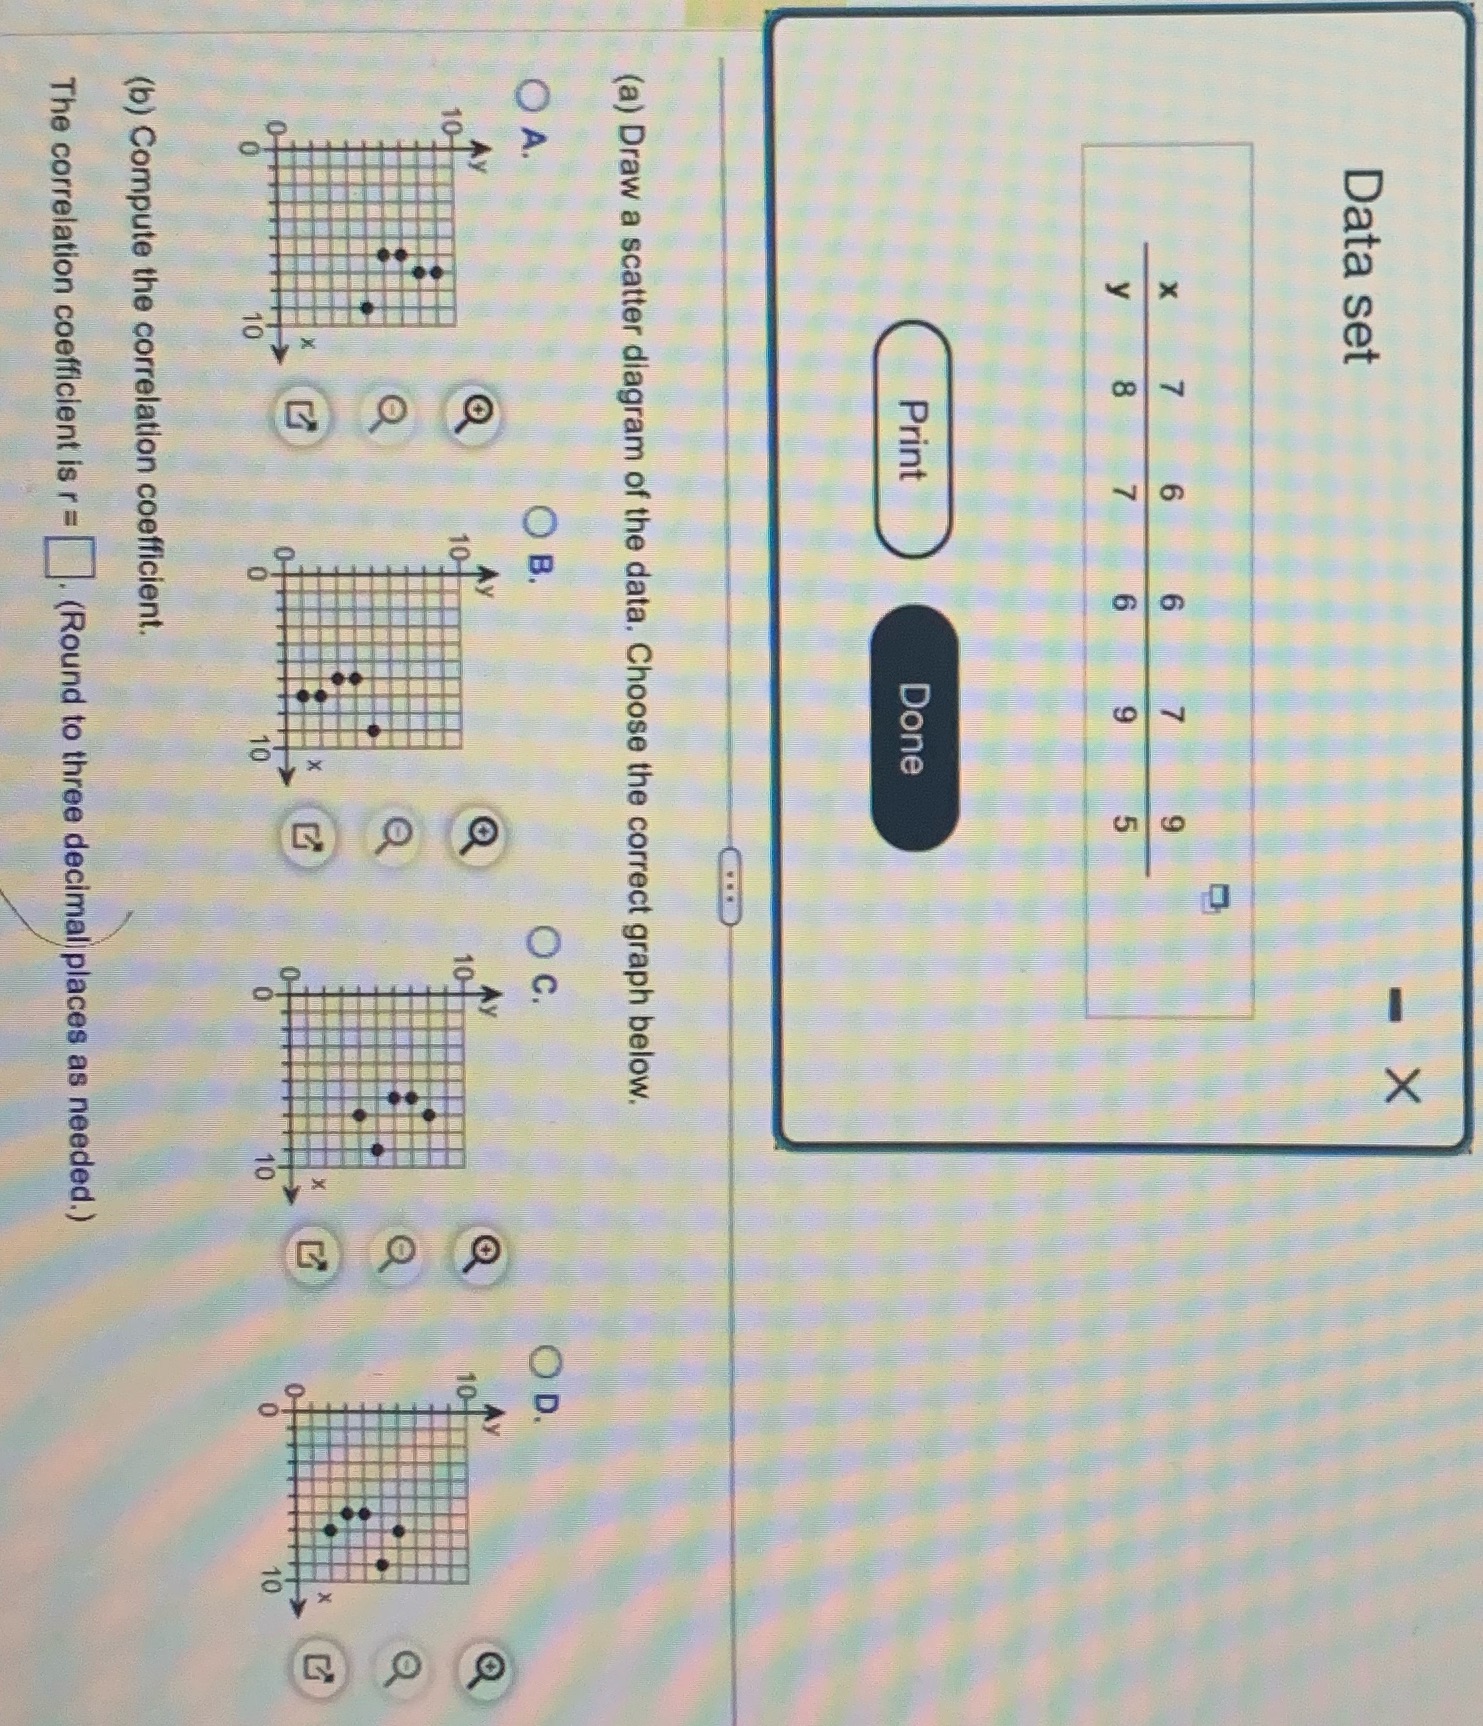
X Data set Print Done (a) Draw a scatter diagram of the data. Choose the correct graph below. O A. OB. O c. OD. 10- 10- O (b) Compute the correlation coefficient. The correlation coefficient is r= . (Round to three decimal places as needed.)
Step by Step Solution
There are 3 Steps involved in it
1 Expert Approved Answer
Step: 1 Unlock

Question Has Been Solved by an Expert!
Get step-by-step solutions from verified subject matter experts
Step: 2 Unlock
Step: 3 Unlock