

Question: - - X Data Table (Click on the icon located on the top-right corner of the data table below in order to copy its contents
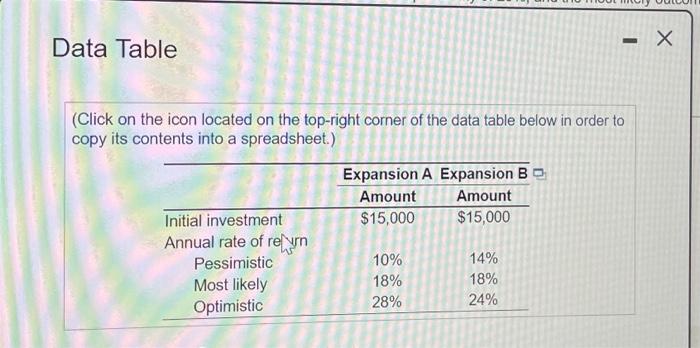
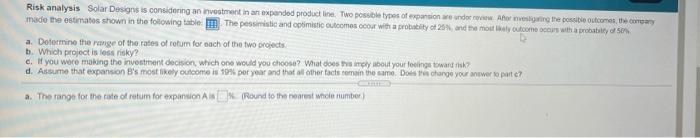
- - X Data Table (Click on the icon located on the top-right corner of the data table below in order to copy its contents into a spreadsheet.) Expansion A Expansion B Amount Amount Initial investment $15,000 $15,000 Annual rate of reyn Pessimistic 10% 14% Most likely 18% 18% Optimistic 28% 24% Risk analysis Solar Designs is considering an investment in an expanded product line. Two possible types of expansion we under her eventing the possible outcomes company made the estimates shown in the following table The pessimistic and optimistic outcomes out with a probability of 20 and the moutal como com with a probability for a. Dotermine the range of the rates of return for each of the two projects b. Which project is less risky? c. If you were making the investment decision, which one would you choose? What does this imply out your fooling towards d. Assume that expansion B's most likely outcome is 10% per year and that all other facts remain the same. Does change your answer to parte? a. The range for the rate of retum for expansion (Round to the nearest whole number
Step by Step Solution
There are 3 Steps involved in it

Get step-by-step solutions from verified subject matter experts