

Question: - X Data Table Click on the Icon located on the top-right corner of the data table in order to copy its contents into a
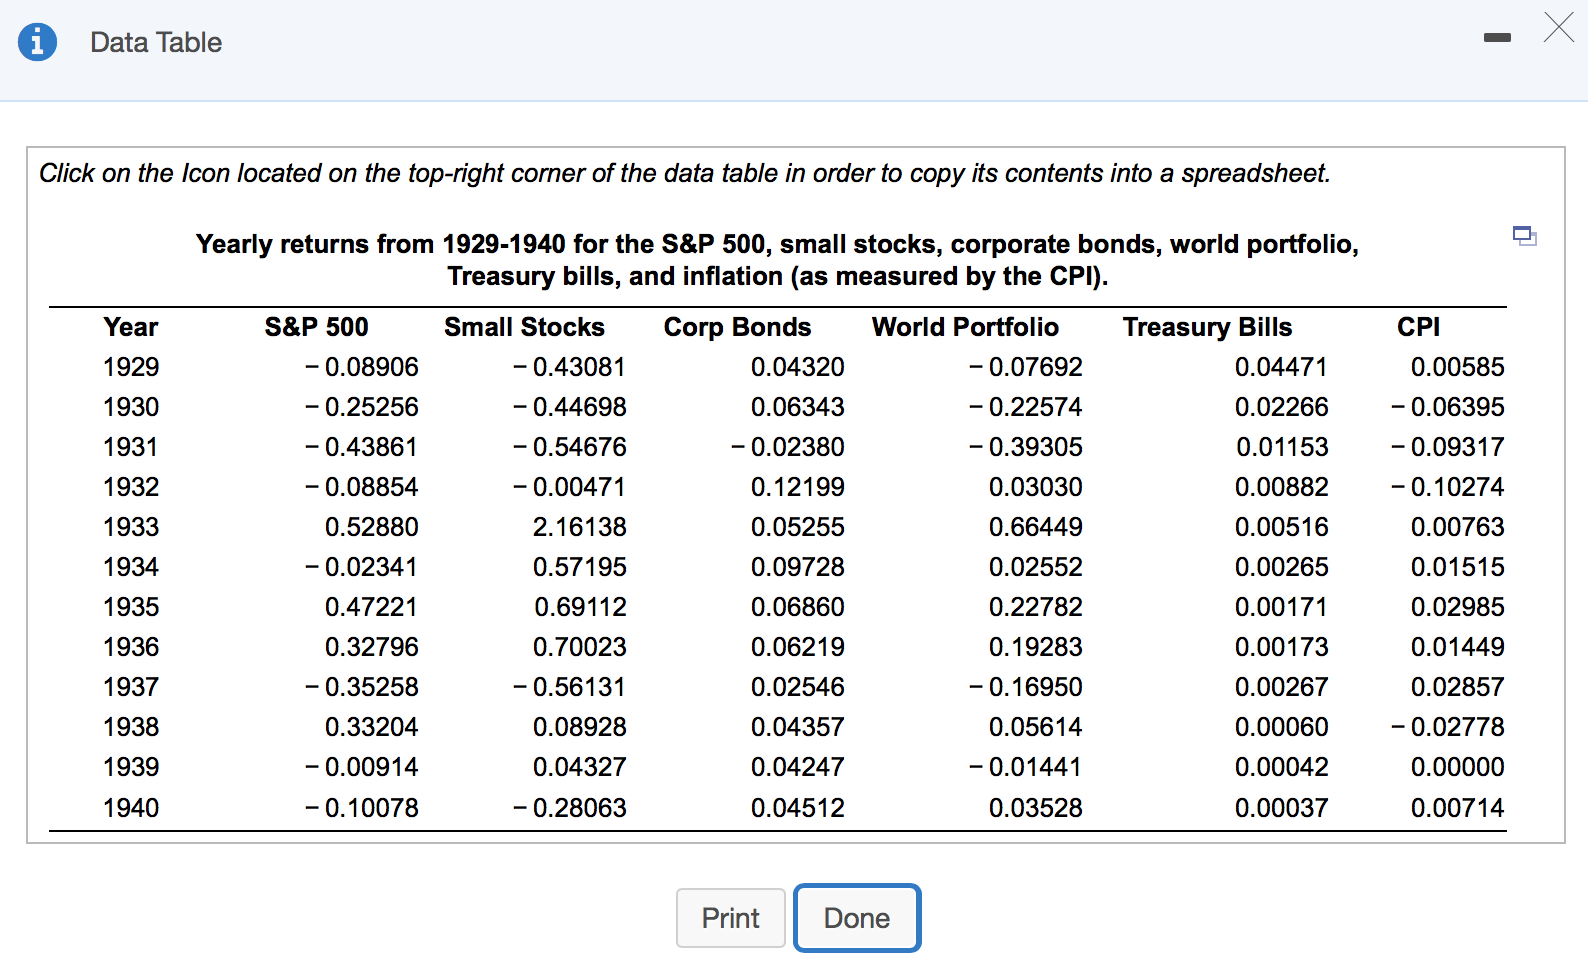
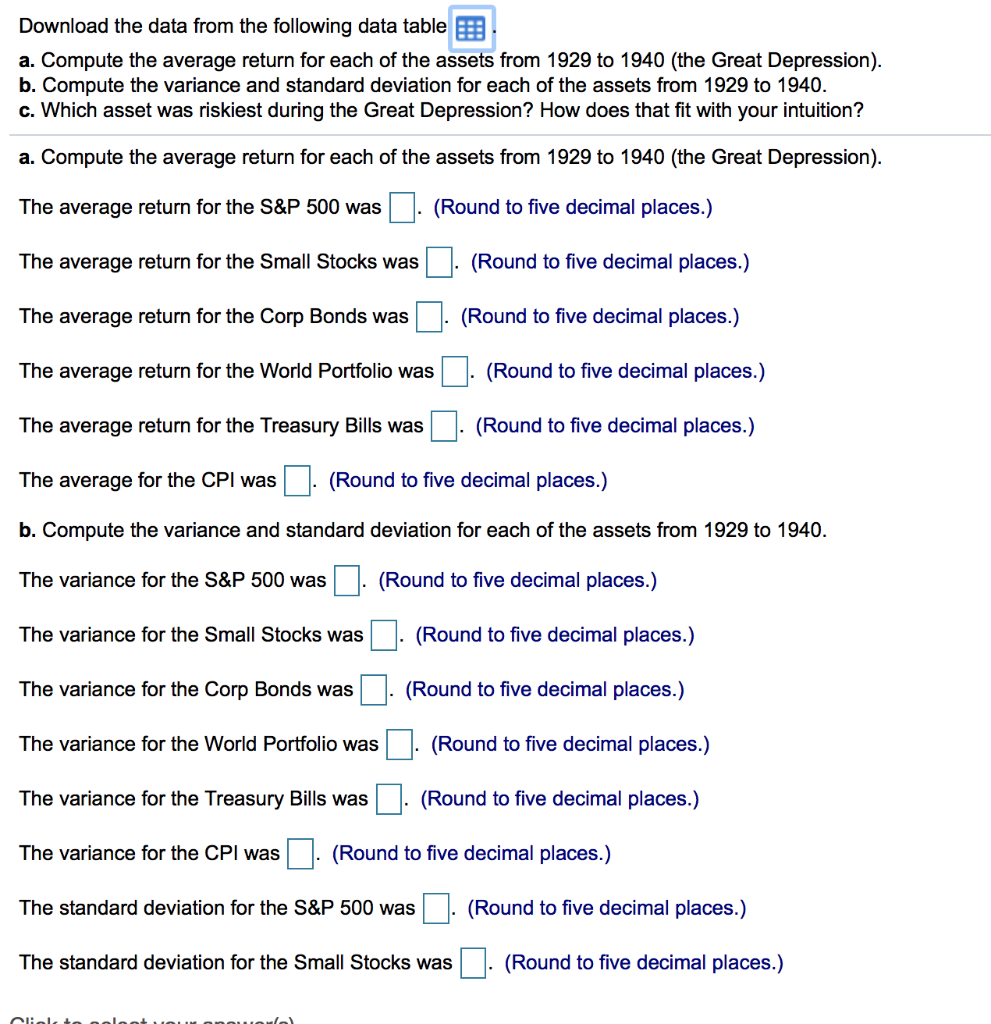
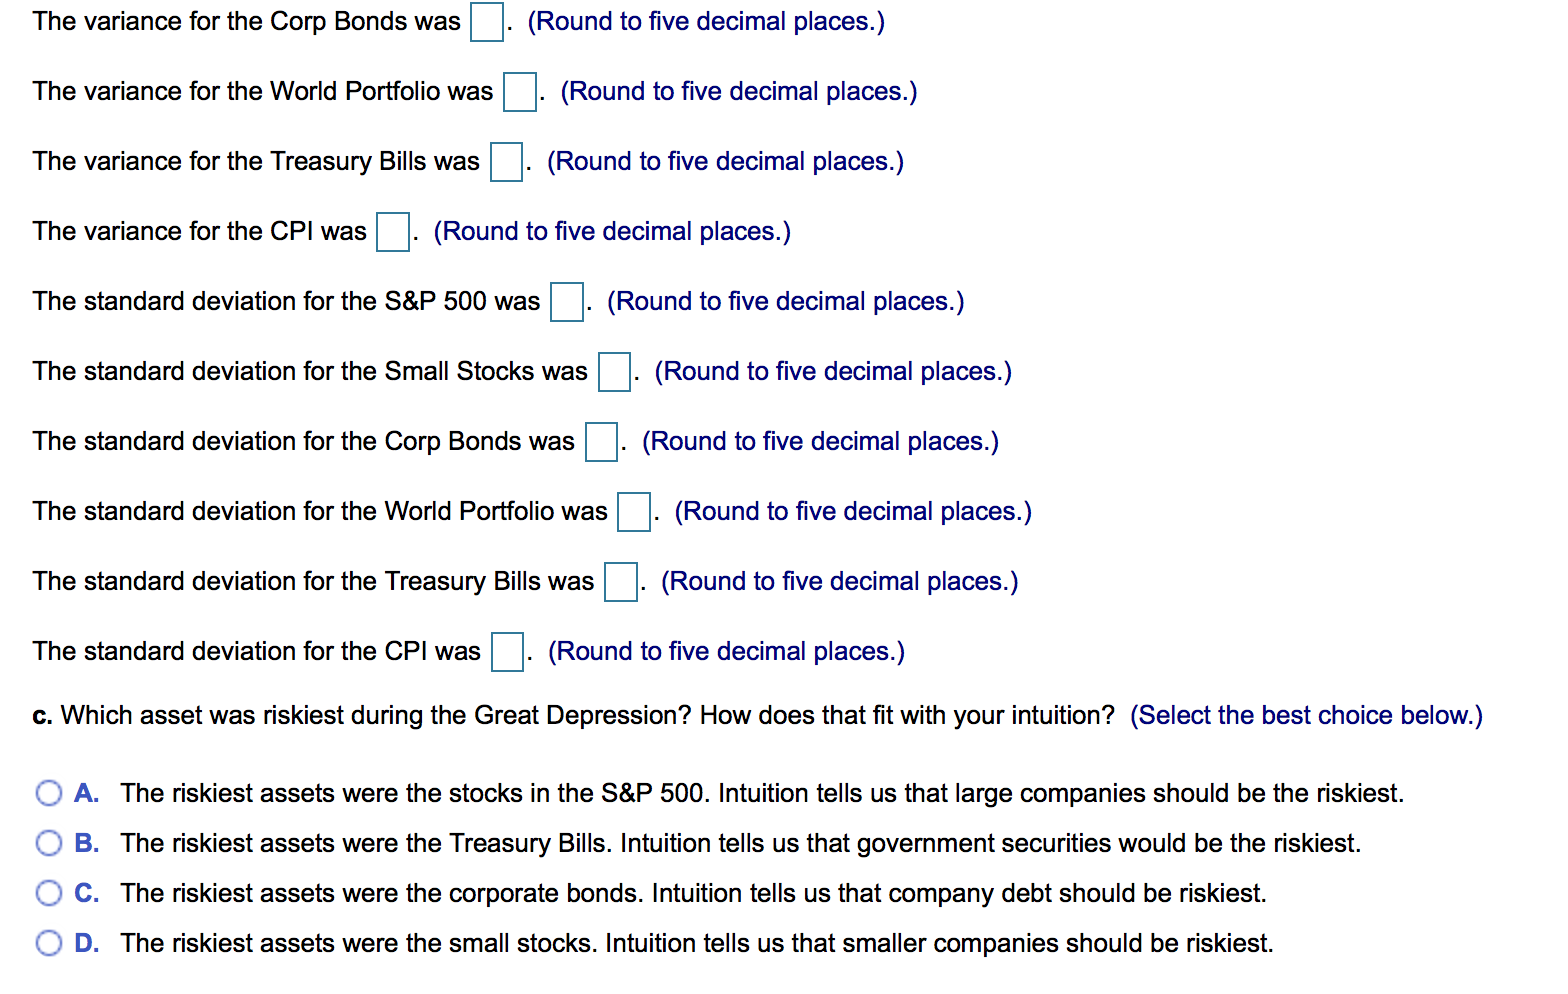
- X Data Table Click on the Icon located on the top-right corner of the data table in order to copy its contents into a spreadsheet. Yearly returns from 1929-1940 for the S&P 500, small stocks, corporate bonds, world portfolio, Treasury bills, and inflation (as measured by the CPI). Year S&P 500 Small Stocks World Portfolio CPI Treasury Bills 0.04471 1929 -0.08906 -0.43081 Corp Bonds 0.04320 0.06343 -0.07692 0.00585 -0.06395 1930 -0.44698 -0.22574 0.02266 1931 1932 1933 -0.25256 -0.43861 -0.08854 -0.54676 -0.00471 2.16138 -0.02380 0.12199 0.05255 -0.39305 0.03030 0.01153 0.00882 0.00516 -0.09317 -0.10274 0.00763 0.01515 0.52880 0.66449 1934 -0.02341 0.57195 0.09728 0.02552 0.00265 0.47221 0.06860 0.00171 0.02985 1935 1936 0.69112 0.70023 0.22782 0.19283 0.32796 0.06219 0.01449 0.00173 0.00267 -0.56131 0.02857 1937 1938 -0.35258 0.33204 -0.00914 0.02546 0.04357 -0.16950 0.05614 0.08928 0.02778 0.00060 0.00042 1939 0.04327 0.04247 -0.01441 0.00000 1940 -0.10078 -0.28063 0.04512 0.03528 0.00037 0.00714 Print Done Download the data from the following data table a. Compute the average return for each of the assets from 1929 to 1940 (the Great Depression). b. Compute the variance and standard deviation for each of the assets from 1929 to 1940. c. Which asset was riskiest during the Great Depression? How does that fit with your intuition? a. Compute the average return for each of the assets from 1929 to 1940 (the Great Depression). The average return for the S&P 500 was (Round to five decimal places.) The average return for the Small Stocks was (Round to five decimal places.) The average return for the Corp Bonds was (Round to five decimal places.) The average return for the World Portfolio was (Round to five decimal places.) The average return for the Treasury Bills was (Round to five decimal places.) The average for the CPI was (Round to five decimal places.) b. Compute the variance and standard deviation for each of the assets from 1929 to 1940. The variance for the S&P 500 was (Round to five decimal places.) The variance for the Small Stocks was (Round to five decimal places.) The variance for the Corp Bonds was (Round to five decimal places.) The variance for the World Portfolio was (Round to five decimal places.) The variance for the Treasury Bills was (Round to five decimal places.) The variance for the CPI was (Round to five decimal places.) The standard deviation for the S&P 500 was (Round to five decimal places.) The standard deviation for the Small Stocks was 1. (Round to five decimal places.) Clial The variance for the Corp Bonds was (Round to five decimal places.) The variance for the World Portfolio was (Round to five decimal places.) The variance for the Treasury Bills was (Round to five decimal places.) The variance for the CPI was (Round to five decimal places.) The standard deviation for the S&P 500 was (Round to five decimal places.) The standard deviation for the Small Stocks was (Round to five decimal places.) The standard deviation for the Corp Bonds was (Round to five decimal places.) The standard deviation for the World Portfolio was (Round to five decimal places.) The standard deviation for the Treasury Bills was (Round to five decimal places.) The standard deviation for the CPI was (Round to five decimal places.) c. Which asset was riskiest during the Great Depression? How does that fit with your intuition? (Select the best choice below.) A. The riskiest assets were the stocks in the S&P 500. Intuition tells us that large companies should be the riskiest. B. The riskiest assets were the Treasury Bills. Intuition tells us that government securities would be the riskiest. C. The riskiest assets were the corporate bonds. Intuition tells us that company debt should be riskiest. D. The riskiest assets were the small stocks. Intuition tells us that smaller companies should be riskiest
Step by Step Solution
There are 3 Steps involved in it

Get step-by-step solutions from verified subject matter experts