

Question: -X Data Table mc cull , pla (Click on the icon here in order to copy the contents of the data table below into a
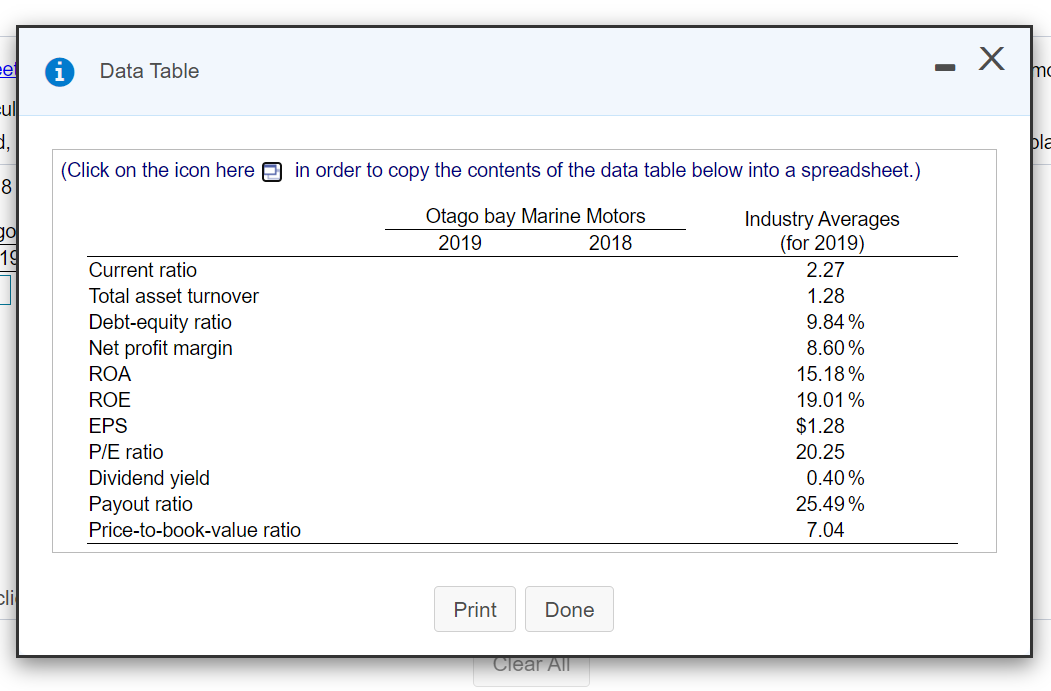
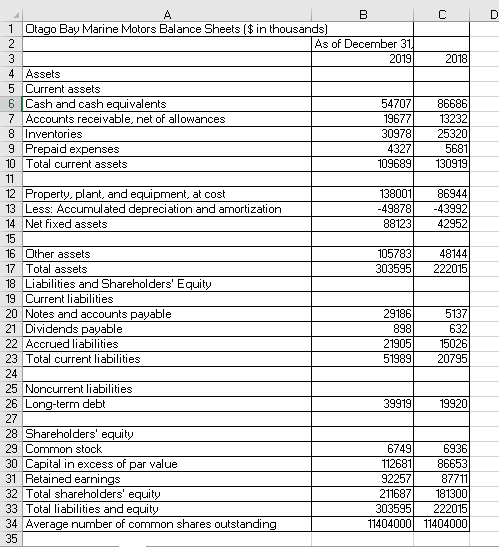
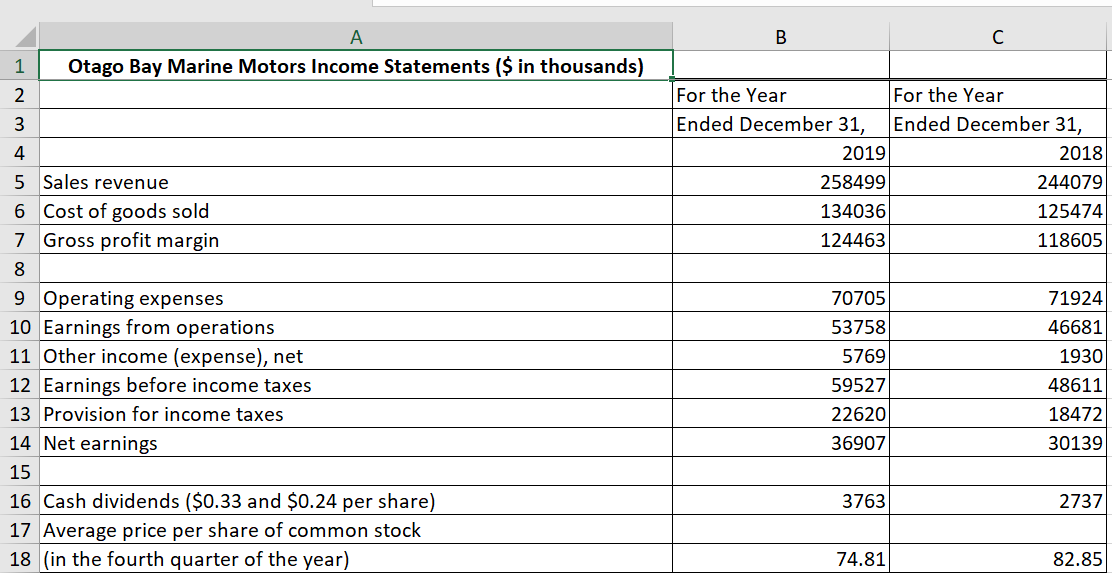
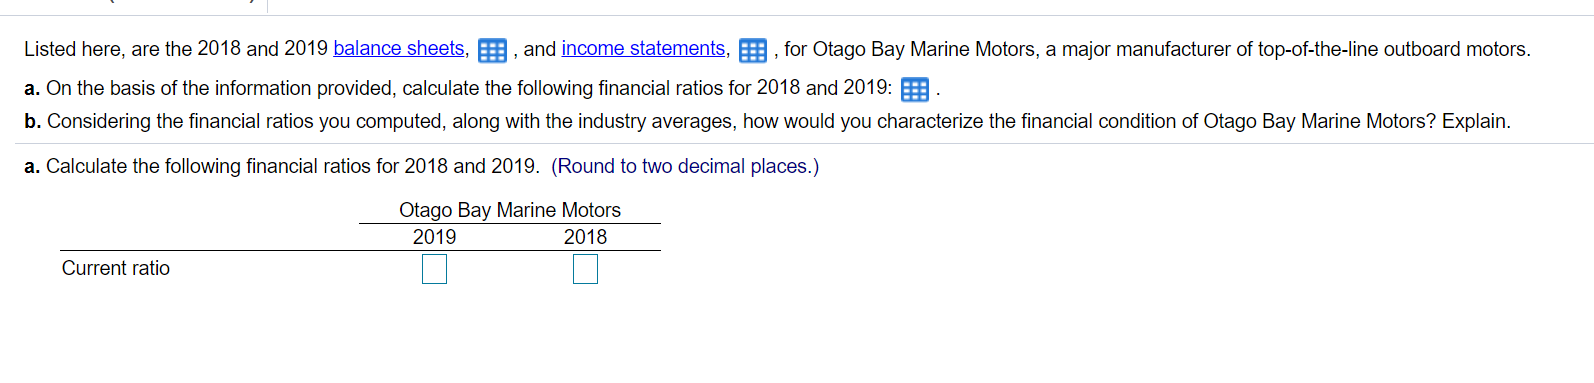
-X Data Table mc cull , pla (Click on the icon here in order to copy the contents of the data table below into a spreadsheet.) 8 ga 19 Otago bay Marine Motors 2019 2018 Current ratio Total asset turnover Debt-equity ratio Net profit margin ROA ROE EPS P/E ratio Dividend yield Payout ratio Price-to-book-value ratio Industry Averages (for 2019) 2.27 1.28 9.84 % 8.60% 15.18% 19.01% $1.28 20.25 0.40% 25.49% 7.04 cli Print Done Clear All D A B C 1 Otago Bay Marine Motors Balance Sheets ($ in thousands) 2 As of December 31 3 2019 2018 4 Assets 5 Current assets 6 Cash and cash equivalents 54707 86686 7 Accounts receivable, net of allowances 19677 13232 8 Inventories 30978 25320 9 Prepaid expenses 4327 5681 10 Total current assets 109689 130919 11 12 Property, plant, and equipment, at cost 138001 86944 13 Less: Accumulated depreciation and amortization -49878 -43992 14 Net fixed assets 88123 42952 15 16 Other assets 105783 48144 17 Total assets 303595 222015 18 Liabilities and Shareholders' Equity 19 Current liabilities 20 Notes and accounts payable 29186 5137 21 Dividends payable 898 632 22 Accrued liabilities 21905 15026 23 Total current liabilities 51989 20795 24 25 Noncurrent liabilities 26 Long-term debt 39919 19920 27 28 Shareholders' equity 29 Common stock 6749 6936 30 Capital in excess of par value 112681 86653 31 Retained earnings 92257 87711 32 Total shareholders' equity 211687 181300 33 Total liabilities and equity 303595 222015 34 Average number of common shares outstanding 11404000 11404000 35 A B C 1 Otago Bay Marine Motors Income Statements ($ in thousands) 2 3 For the Year For the Year Ended December 31, Ended December 31, 2019 2018 258499 244079 134036 125474 124463 118605 70705 53758 4 5 Sales revenue 6 Cost of goods sold 7 Gross profit margin 8 9 Operating expenses 10 Earnings from operations 11 Other income (expense), net 12 Earnings before income taxes 13 Provision for income taxes 14 Net earnings 15 16 Cash dividends ($0.33 and $0.24 per share) 17 Average price per share of common stock 18 (in the fourth quarter of the year) 71924 46681 1930 48611 5769 59527 22620 36907 18472 30139 3763 2737 74.81 82.85 Listed here, are the 2018 and 2019 balance sheets, B , and income statements, E , for Otago Bay Marine Motors, a major manufacturer of top-of-the-line outboard motors. a. On the basis of the information provided, calculate the following financial ratios for 2018 and 2019: 5. b. Considering the financial ratios you computed, along with the industry averages, how would you characterize the financial condition of Otago Bay Marine Motors? Explain. a. Calculate the following financial ratios for 2018 and 2019. (Round to two decimal places.) Otago Bay Marine Motors 2019 2018 Current ratio -X Data Table mc cull , pla (Click on the icon here in order to copy the contents of the data table below into a spreadsheet.) 8 ga 19 Otago bay Marine Motors 2019 2018 Current ratio Total asset turnover Debt-equity ratio Net profit margin ROA ROE EPS P/E ratio Dividend yield Payout ratio Price-to-book-value ratio Industry Averages (for 2019) 2.27 1.28 9.84 % 8.60% 15.18% 19.01% $1.28 20.25 0.40% 25.49% 7.04 cli Print Done Clear All D A B C 1 Otago Bay Marine Motors Balance Sheets ($ in thousands) 2 As of December 31 3 2019 2018 4 Assets 5 Current assets 6 Cash and cash equivalents 54707 86686 7 Accounts receivable, net of allowances 19677 13232 8 Inventories 30978 25320 9 Prepaid expenses 4327 5681 10 Total current assets 109689 130919 11 12 Property, plant, and equipment, at cost 138001 86944 13 Less: Accumulated depreciation and amortization -49878 -43992 14 Net fixed assets 88123 42952 15 16 Other assets 105783 48144 17 Total assets 303595 222015 18 Liabilities and Shareholders' Equity 19 Current liabilities 20 Notes and accounts payable 29186 5137 21 Dividends payable 898 632 22 Accrued liabilities 21905 15026 23 Total current liabilities 51989 20795 24 25 Noncurrent liabilities 26 Long-term debt 39919 19920 27 28 Shareholders' equity 29 Common stock 6749 6936 30 Capital in excess of par value 112681 86653 31 Retained earnings 92257 87711 32 Total shareholders' equity 211687 181300 33 Total liabilities and equity 303595 222015 34 Average number of common shares outstanding 11404000 11404000 35 A B C 1 Otago Bay Marine Motors Income Statements ($ in thousands) 2 3 For the Year For the Year Ended December 31, Ended December 31, 2019 2018 258499 244079 134036 125474 124463 118605 70705 53758 4 5 Sales revenue 6 Cost of goods sold 7 Gross profit margin 8 9 Operating expenses 10 Earnings from operations 11 Other income (expense), net 12 Earnings before income taxes 13 Provision for income taxes 14 Net earnings 15 16 Cash dividends ($0.33 and $0.24 per share) 17 Average price per share of common stock 18 (in the fourth quarter of the year) 71924 46681 1930 48611 5769 59527 22620 36907 18472 30139 3763 2737 74.81 82.85 Listed here, are the 2018 and 2019 balance sheets, B , and income statements, E , for Otago Bay Marine Motors, a major manufacturer of top-of-the-line outboard motors. a. On the basis of the information provided, calculate the following financial ratios for 2018 and 2019: 5. b. Considering the financial ratios you computed, along with the industry averages, how would you characterize the financial condition of Otago Bay Marine Motors? Explain. a. Calculate the following financial ratios for 2018 and 2019. (Round to two decimal places.) Otago Bay Marine Motors 2019 2018 Current ratio
Step by Step Solution
There are 3 Steps involved in it

Get step-by-step solutions from verified subject matter experts