

Question: X Definition Sample Size, n Lower Range, D3 2 0 3 0 4 0 0 5 Mean Factor, A2 1.880 1.023 0.729 0.577 0.483 0.419
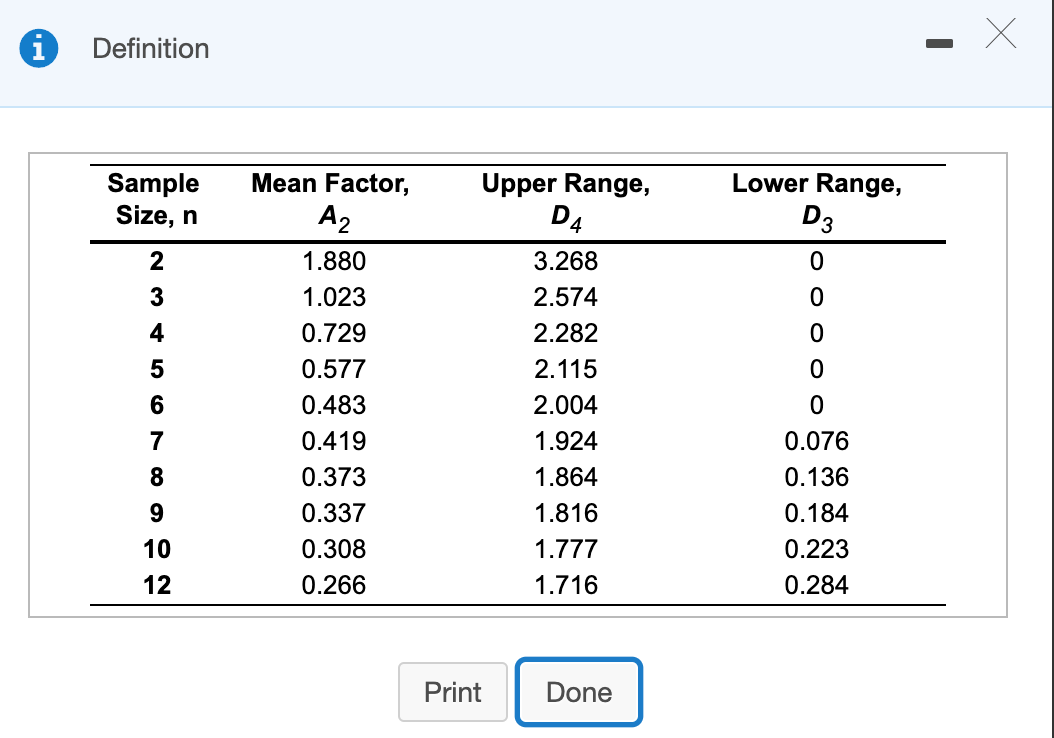
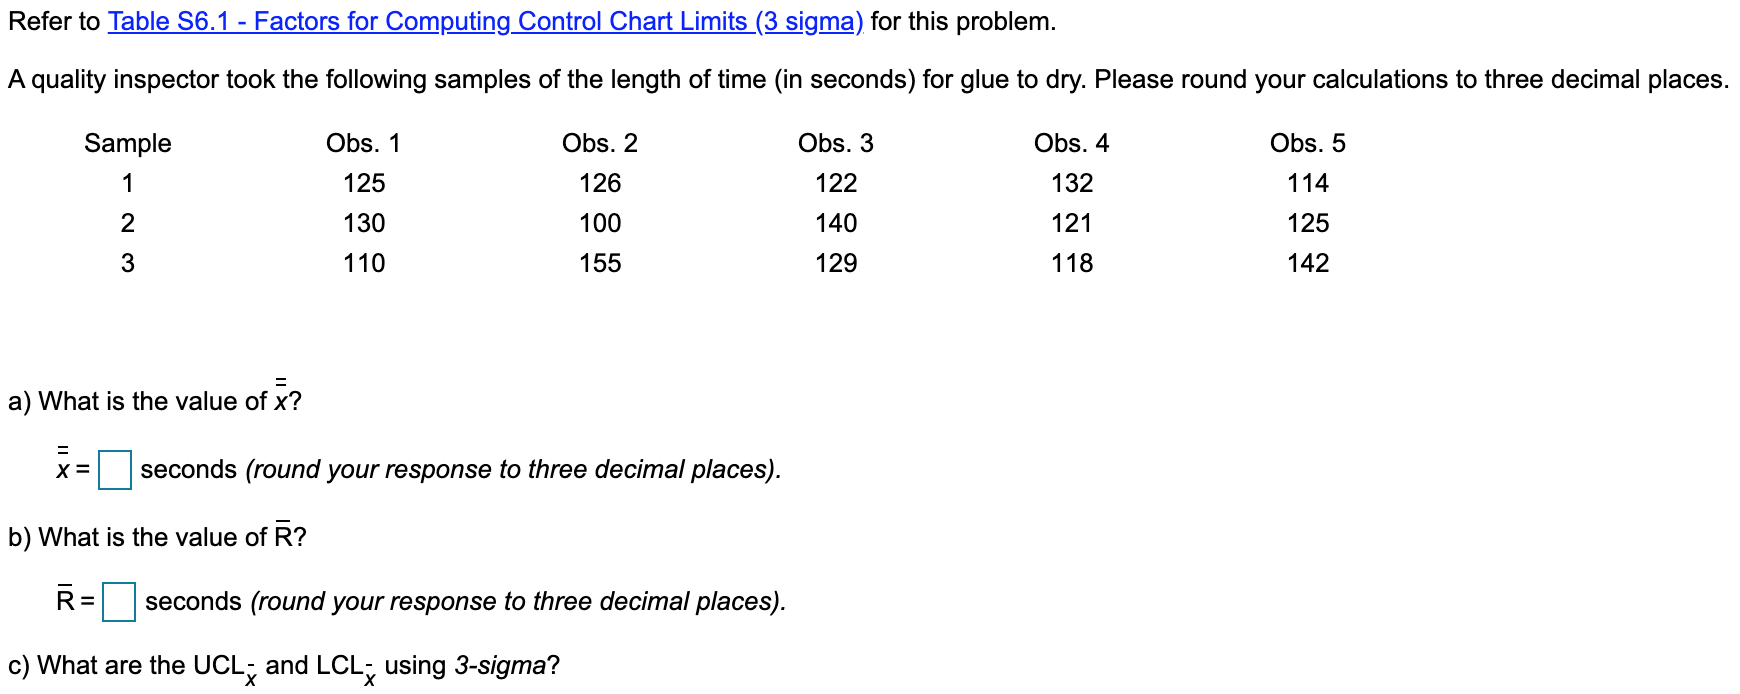
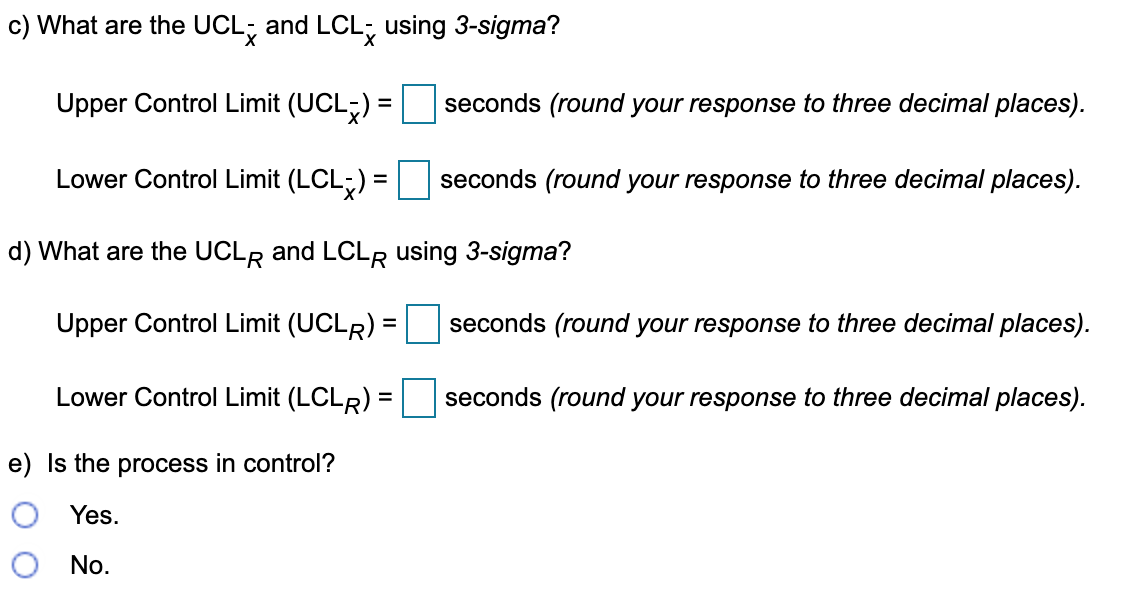
X Definition Sample Size, n Lower Range, D3 2 0 3 0 4 0 0 5 Mean Factor, A2 1.880 1.023 0.729 0.577 0.483 0.419 0.373 0.337 0.308 0.266 Upper Range, D4 3.268 2.574 2.282 2.115 2.004 1.924 1.864 1.816 1.777 1.716 6 7 8 0 0.076 0.136 0.184 0.223 0.284 9 10 12 Print Done Refer to Table S6.1 - Factors for Computing Control Chart Limits (3 sigma) for this problem. A quality inspector took the following samples of the length of time (in seconds) for glue to dry. Please round your calculations to three decimal places. Obs. 1 Obs. 2 Obs. 3 Obs. 4 Obs. 5 Sample 1 125 126 122 132 114 2 130 100 140 121 125 3 110 155 129 118 142 a) What is the value of ? X= seconds (round your response to three decimal places). b) What is the value of R? =seconds (round your response to three decimal places). c) What are the UCL; and LCL; using 3-sigma? c) What are the UCLE and LCL; using 3-sigma? Upper Control Limit (UCL3) = seconds (round your response to three decimal places). Lower Control Limit (LCL;) = seconds (round your response to three decimal places). d) What are the UCLR and LCLR using 3-sigma? Upper Control Limit (UCLR) = = seconds (round your response to three decimal places). Lower Control Limit (LCLR) = seconds (round your response to three decimal places). e) Is process in control? Yes. No
Step by Step Solution
There are 3 Steps involved in it
1 Expert Approved Answer
Step: 1 Unlock

Question Has Been Solved by an Expert!
Get step-by-step solutions from verified subject matter experts
Step: 2 Unlock
Step: 3 Unlock