

Question: X Display from Technology Hypothesis test results: 1 : Mean of variable Ho : H = 2.3 HA : [ > 2.3 Variable Sample Mean

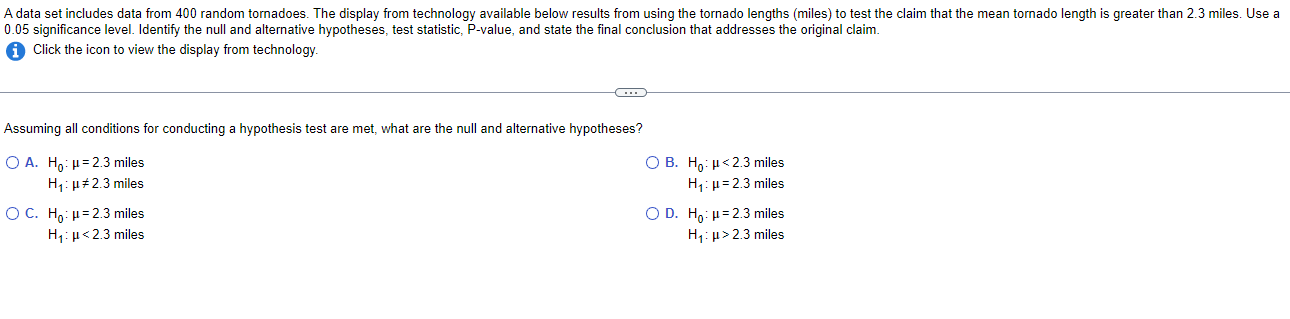
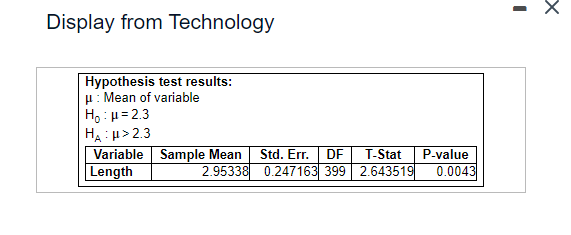

X Display from Technology Hypothesis test results: 1 : Mean of variable Ho : H = 2.3 HA : [ > 2.3 Variable Sample Mean Std. Err. DF T-Stat P-value Length 2.95338 0.247163 399 2.643519 0.0043A data set includes data from 400 random tornadoes. The display from technology available below results irorn using the tornado lengths (miles) to test the claim that the mean tornado length is greaterthan 2.3 miles. Use a 0.05 signicance level. Identify the null and alternative hypotheses, test statistic, Pivalue. and state the final conclusion that addresses the original claim. 0 Click the icon to View the display from technology. Assuming all conditions for conducting a hypothesis test are met, what are the null and alternative hypotheses? C) A. He. u=2.3 miles C) B. H0. p23miles
Step by Step Solution
There are 3 Steps involved in it

Get step-by-step solutions from verified subject matter experts