

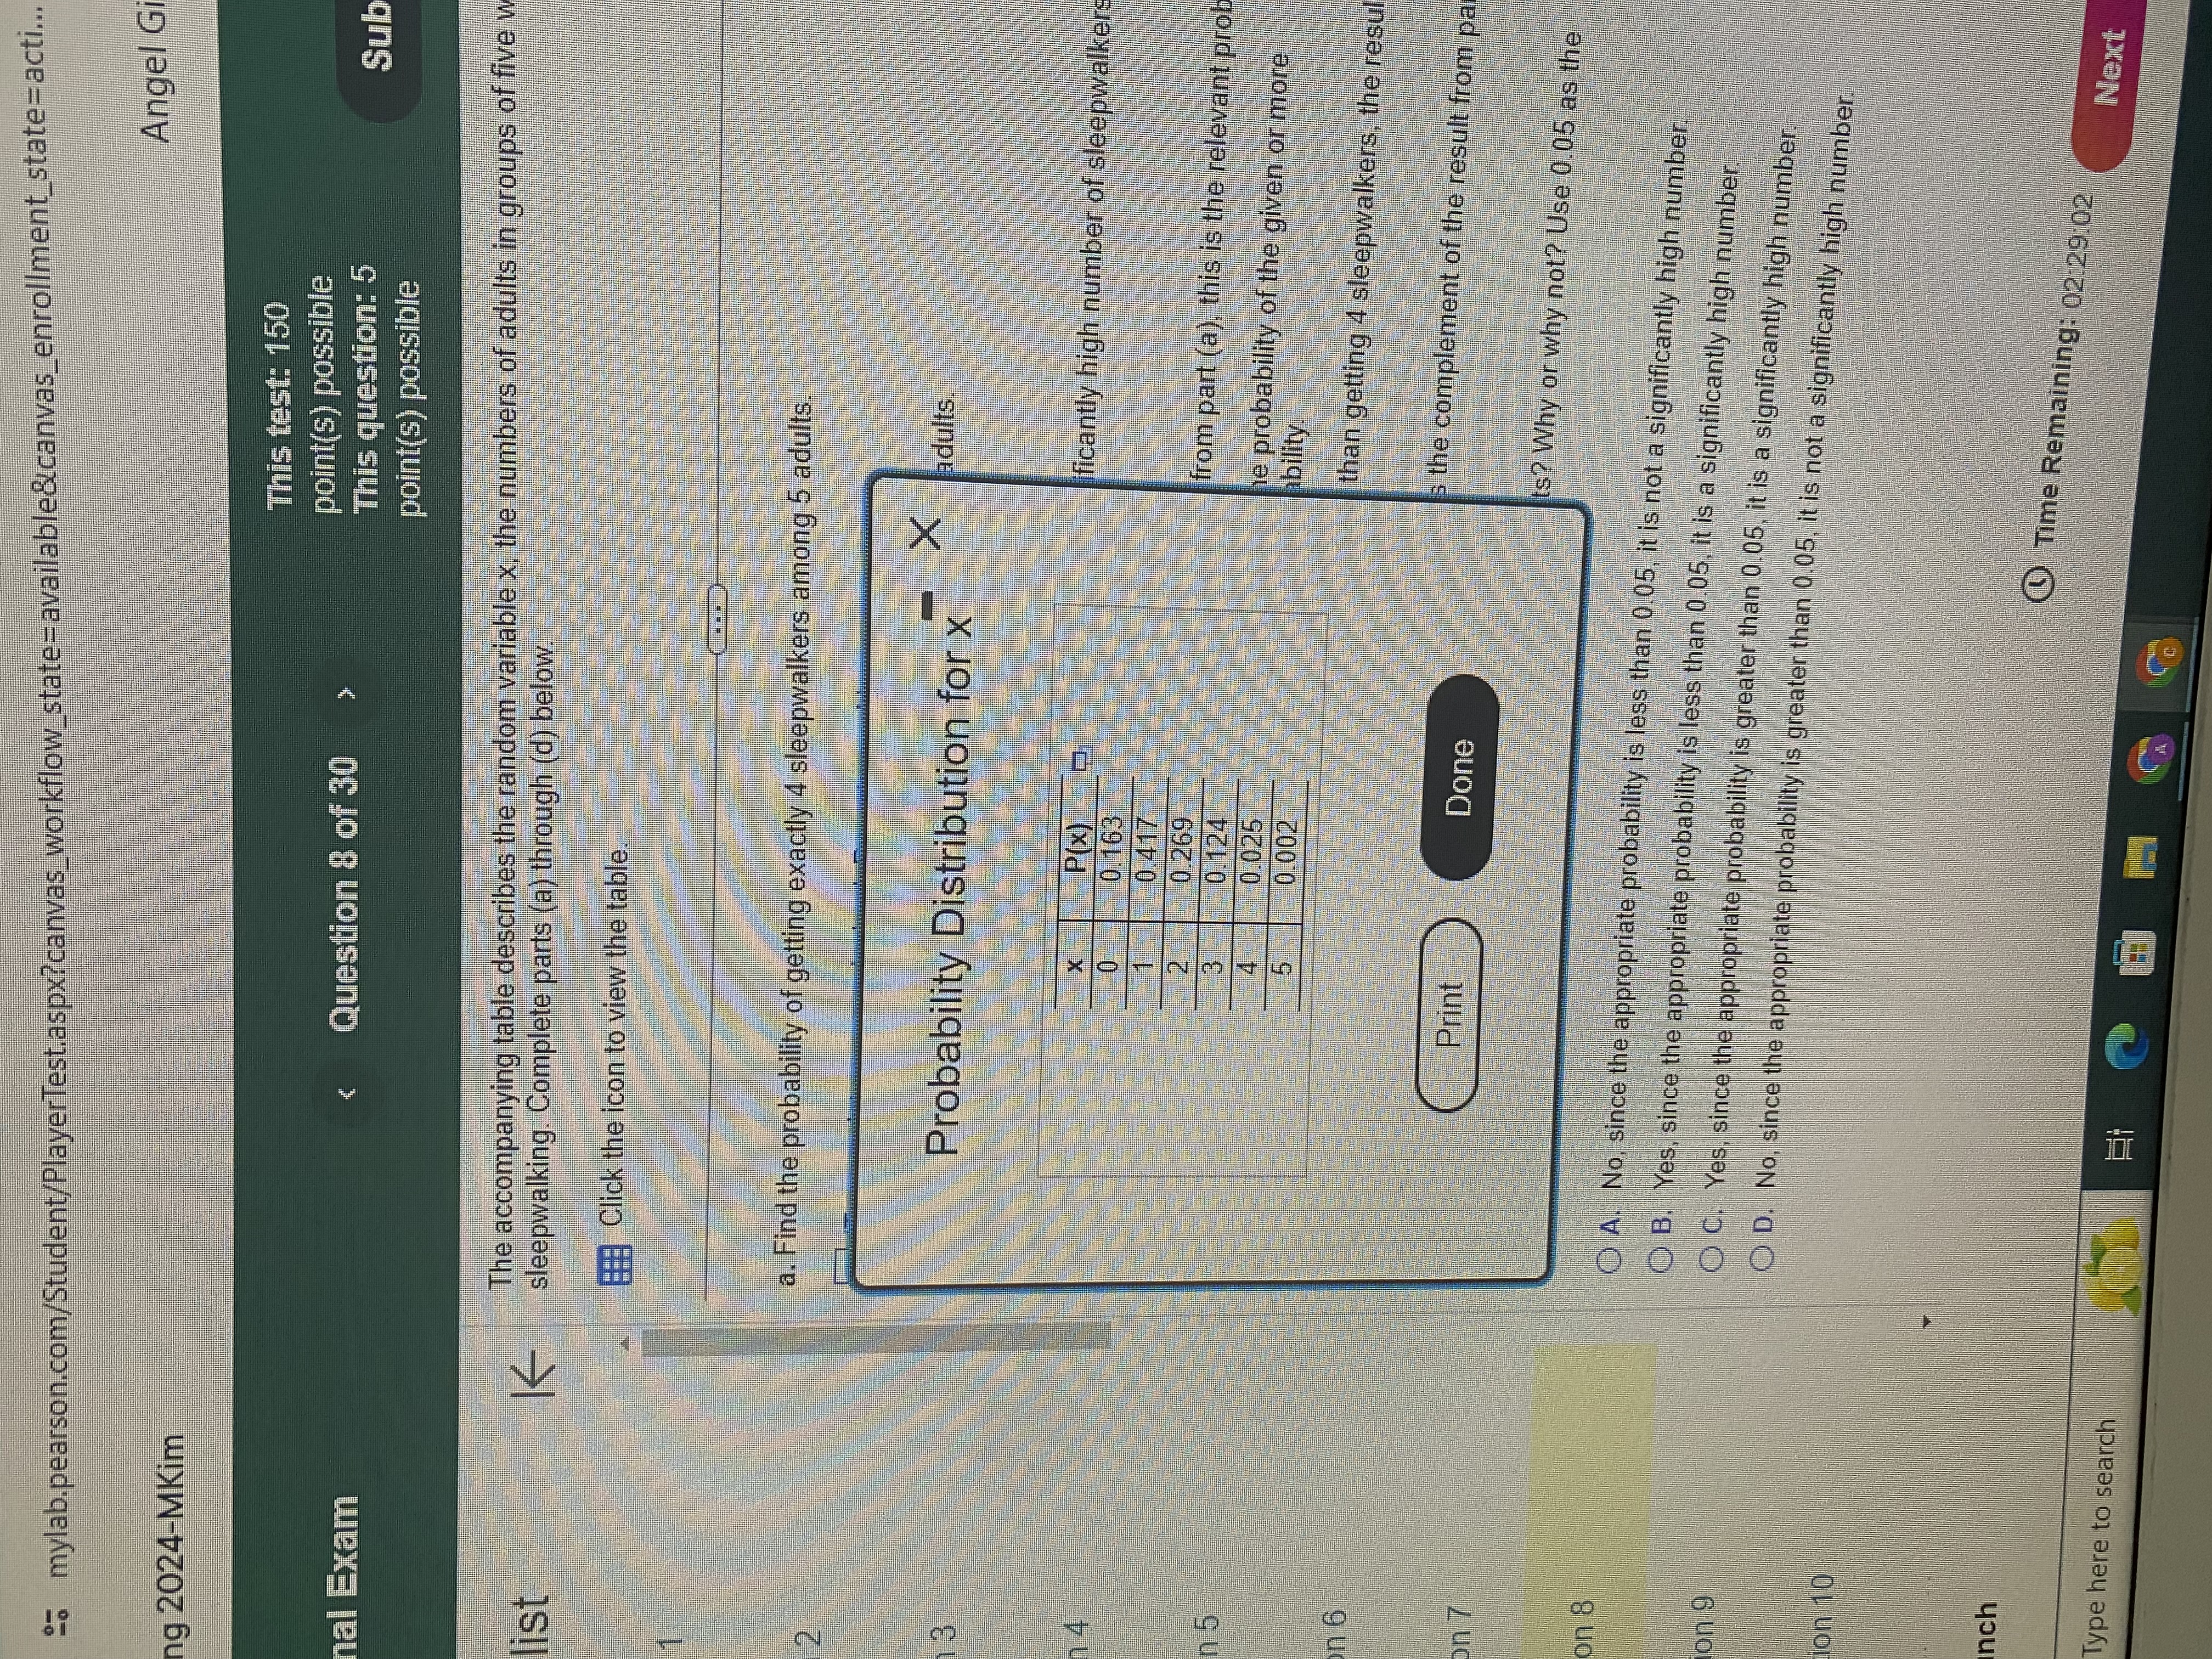
Question: X - Extra Credit X Final Exam mylab.pearson.com/Student/PlayerTest.aspx? canvas_workflow_state = available8(canvas_enrollment_state=acti... Angel Gieng 2024-MKim This test: 150 point(s) possible Exam point(s) possible This question: 5
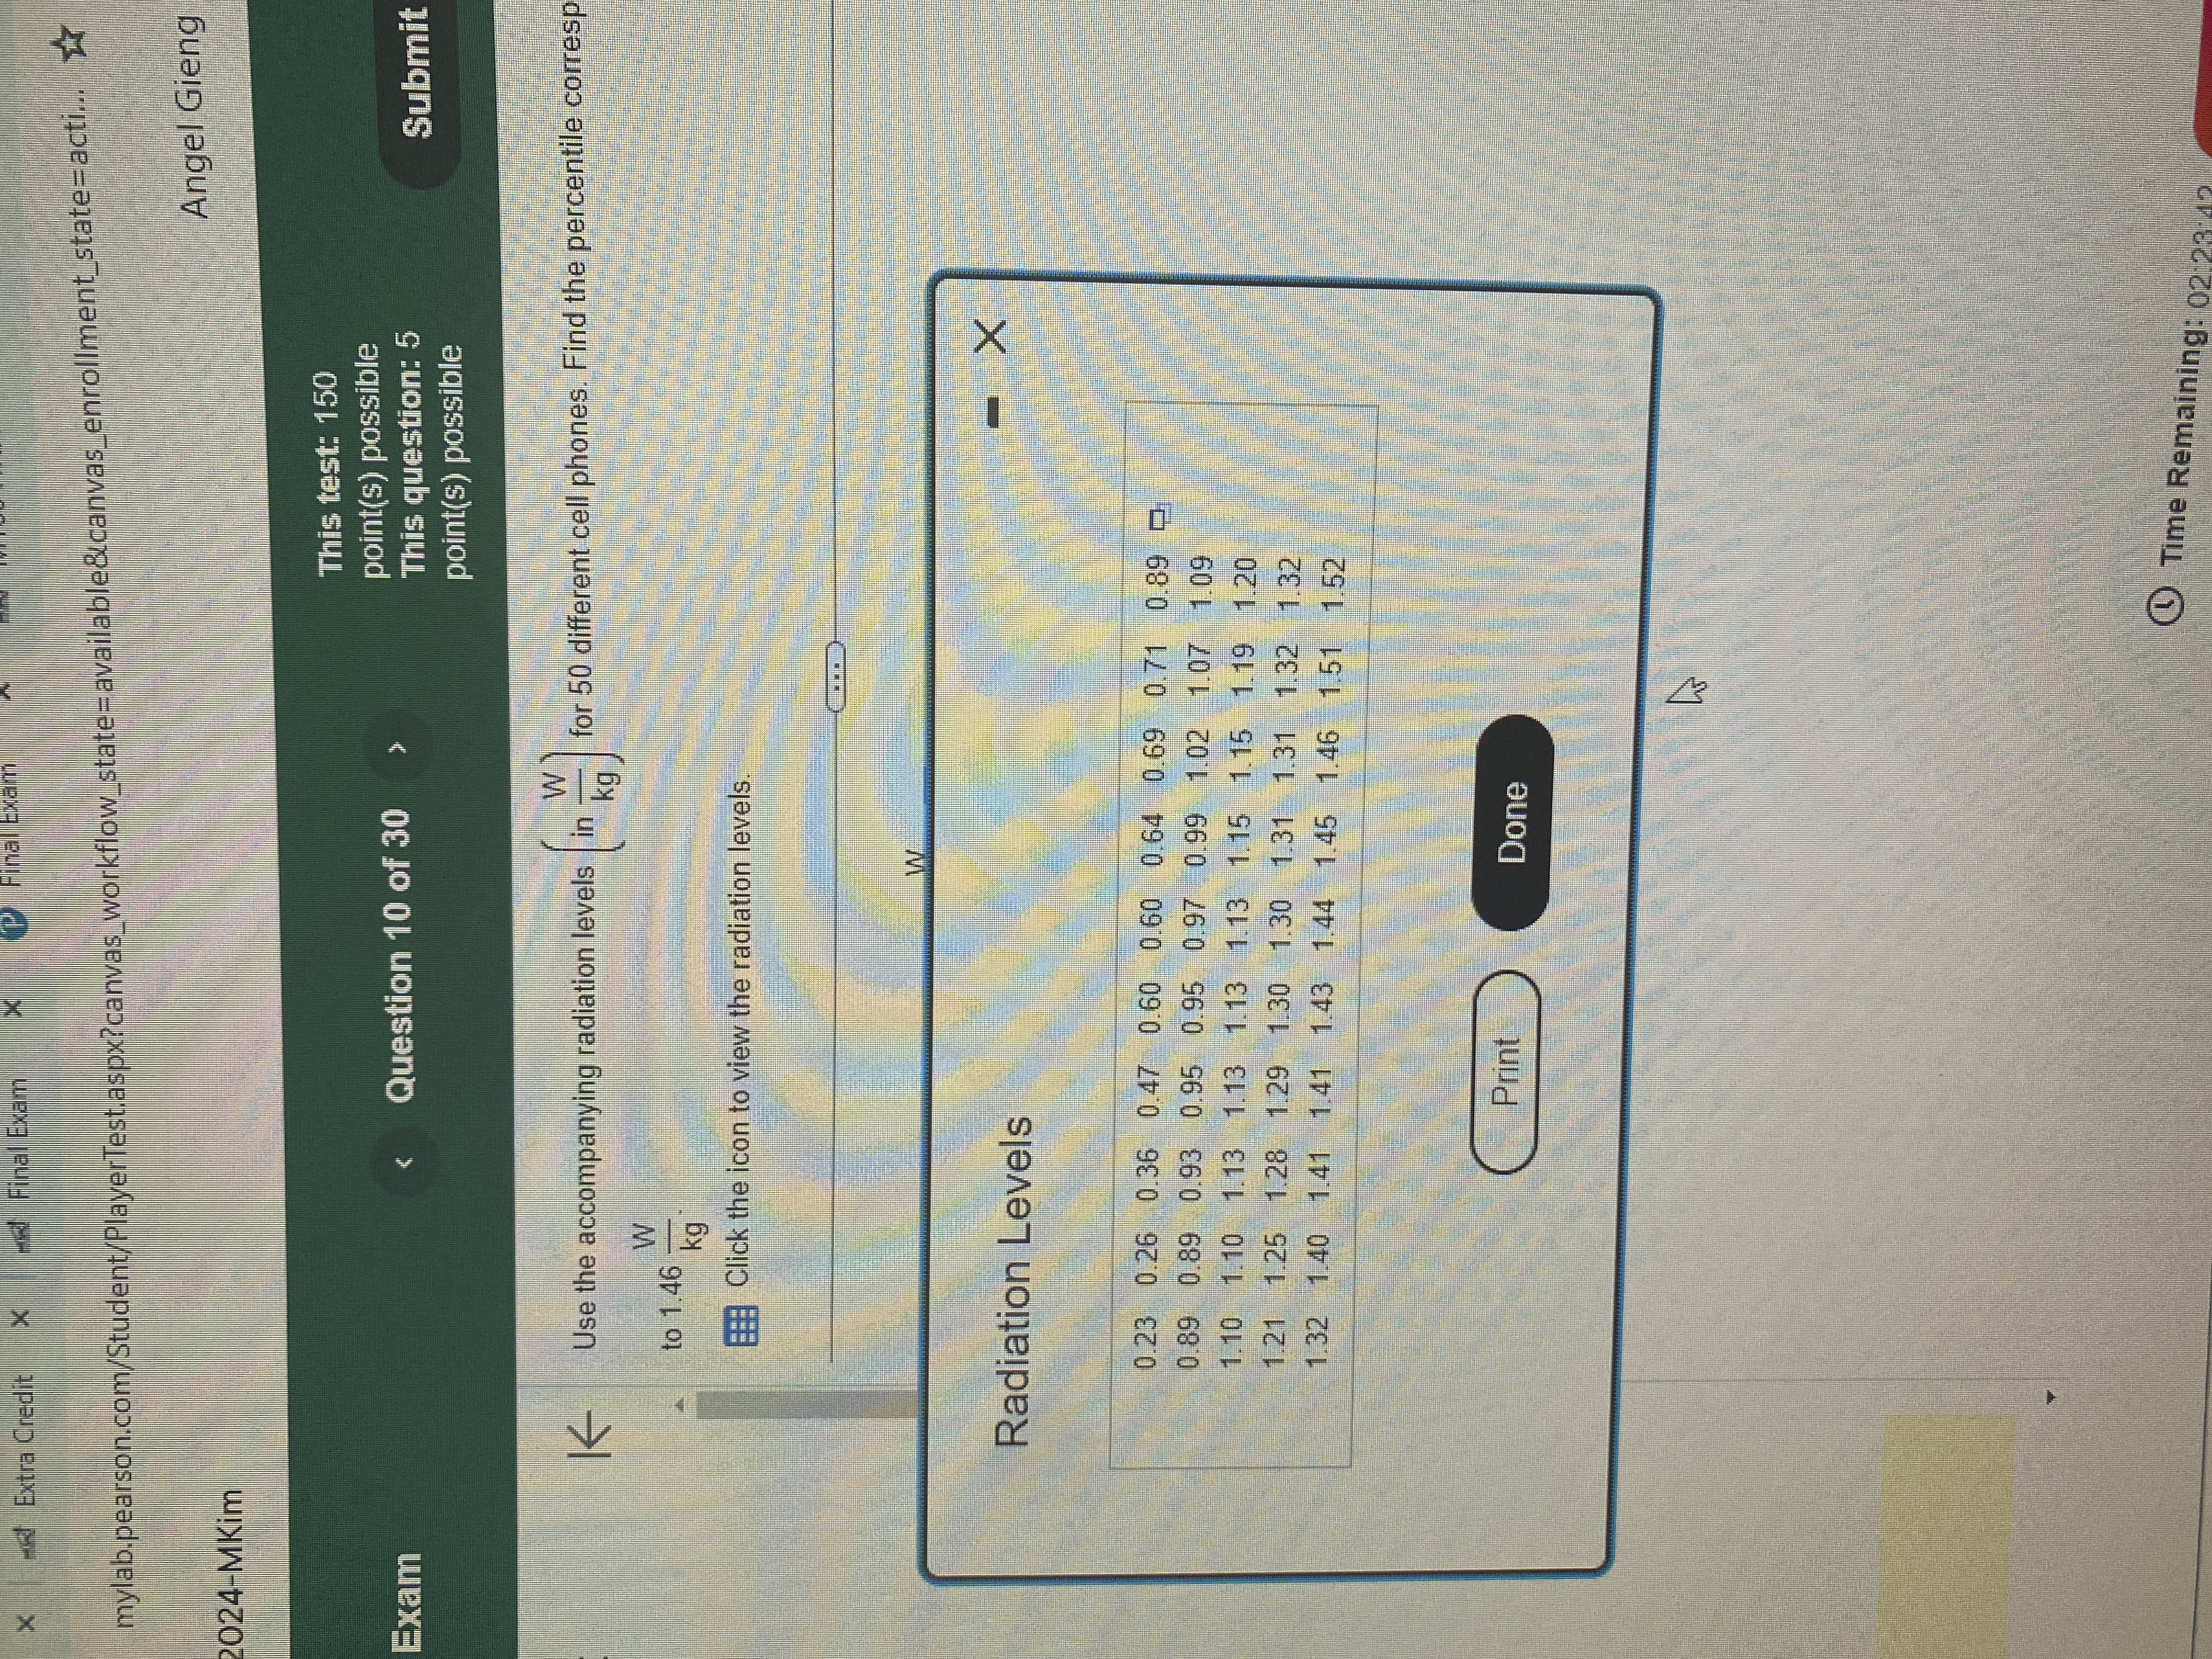
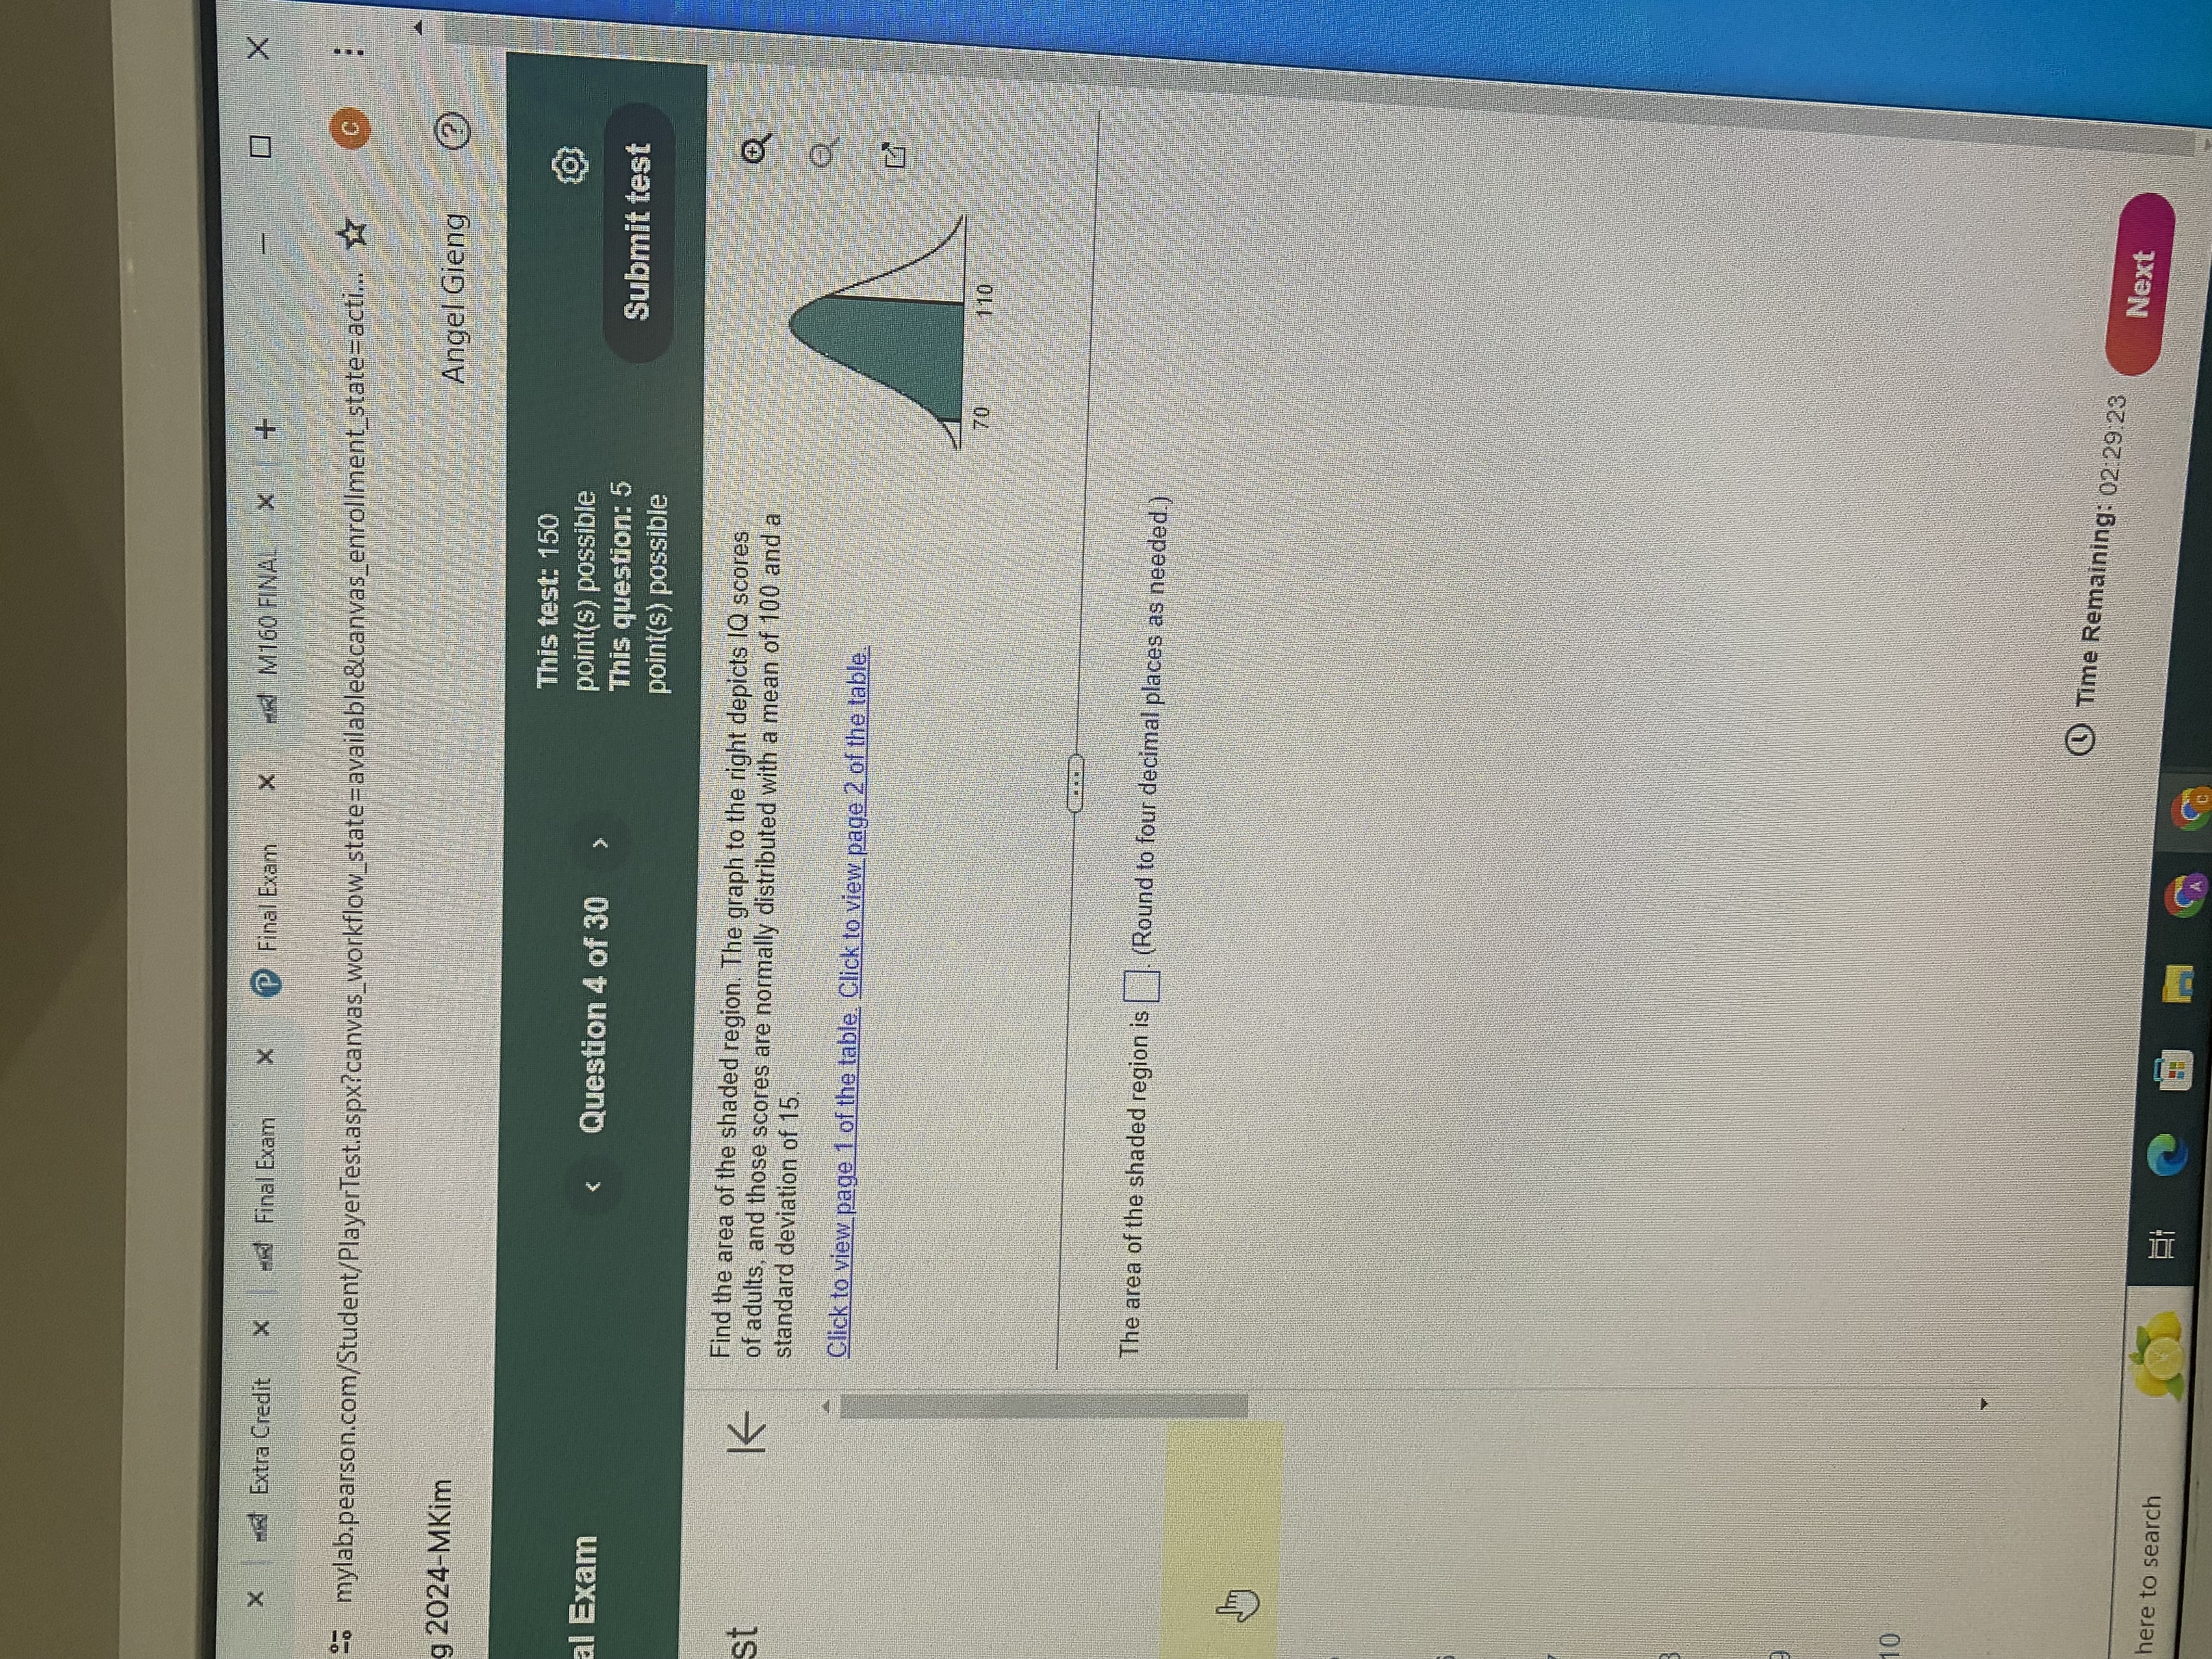
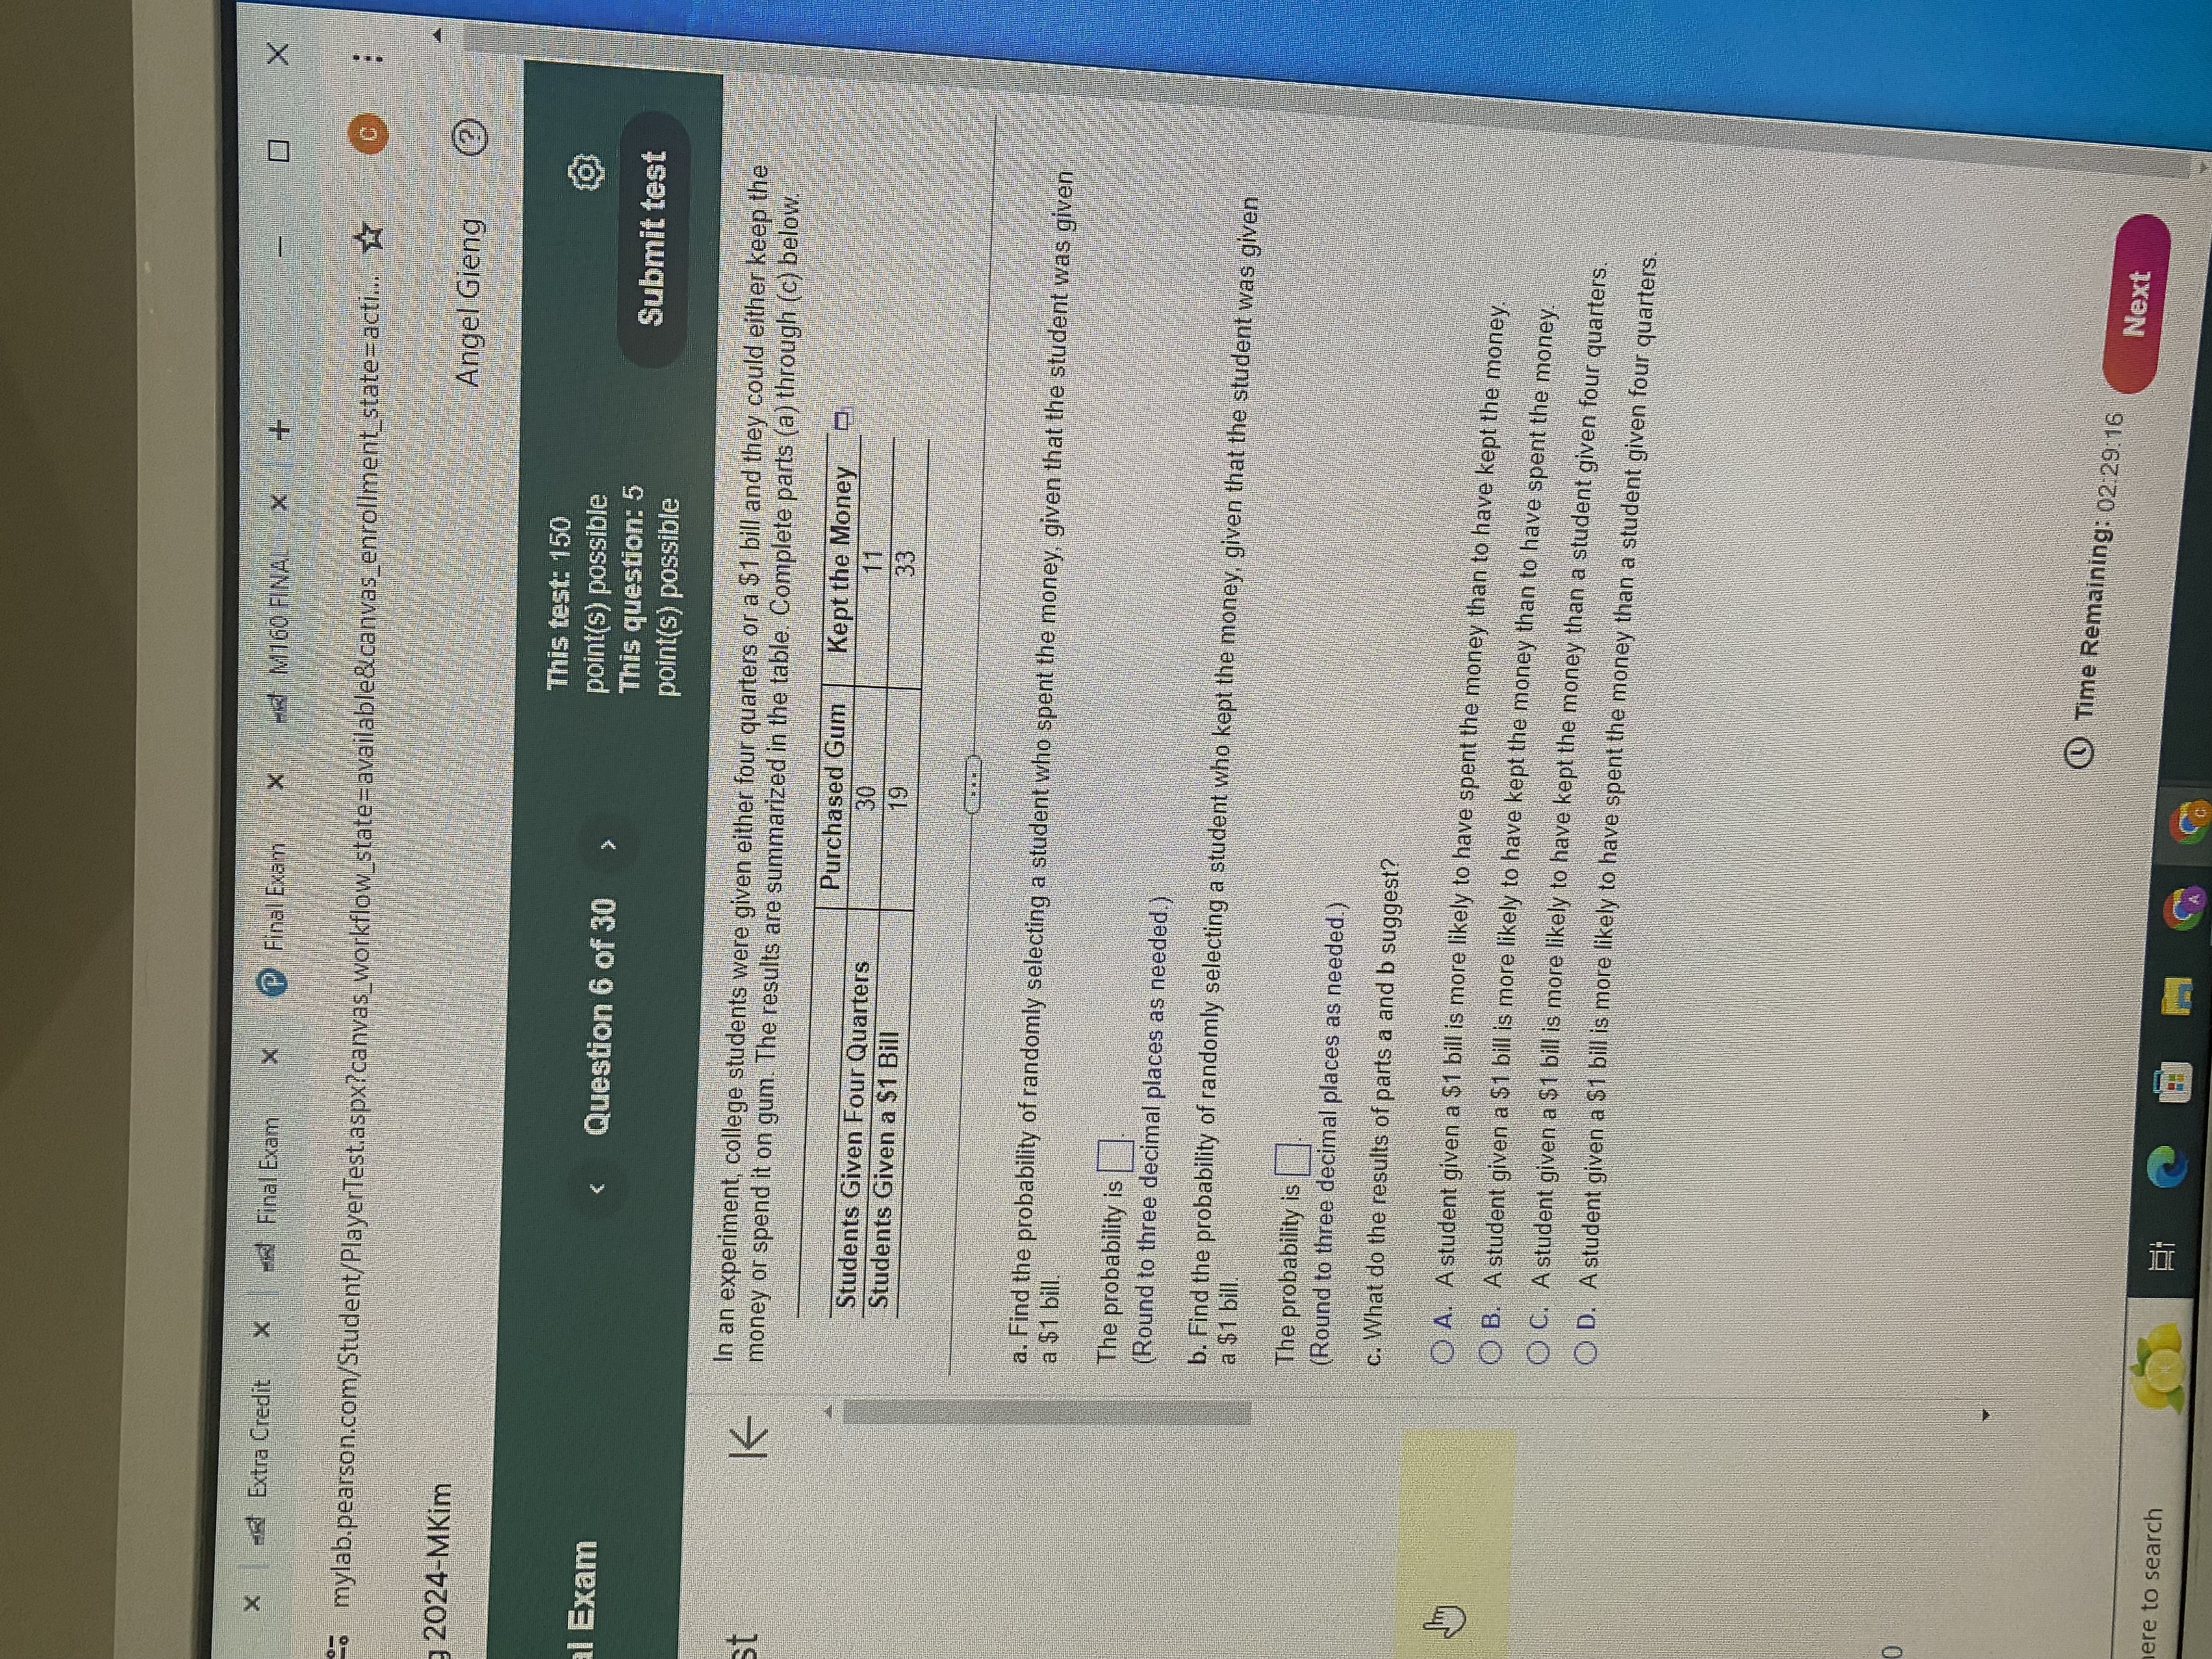
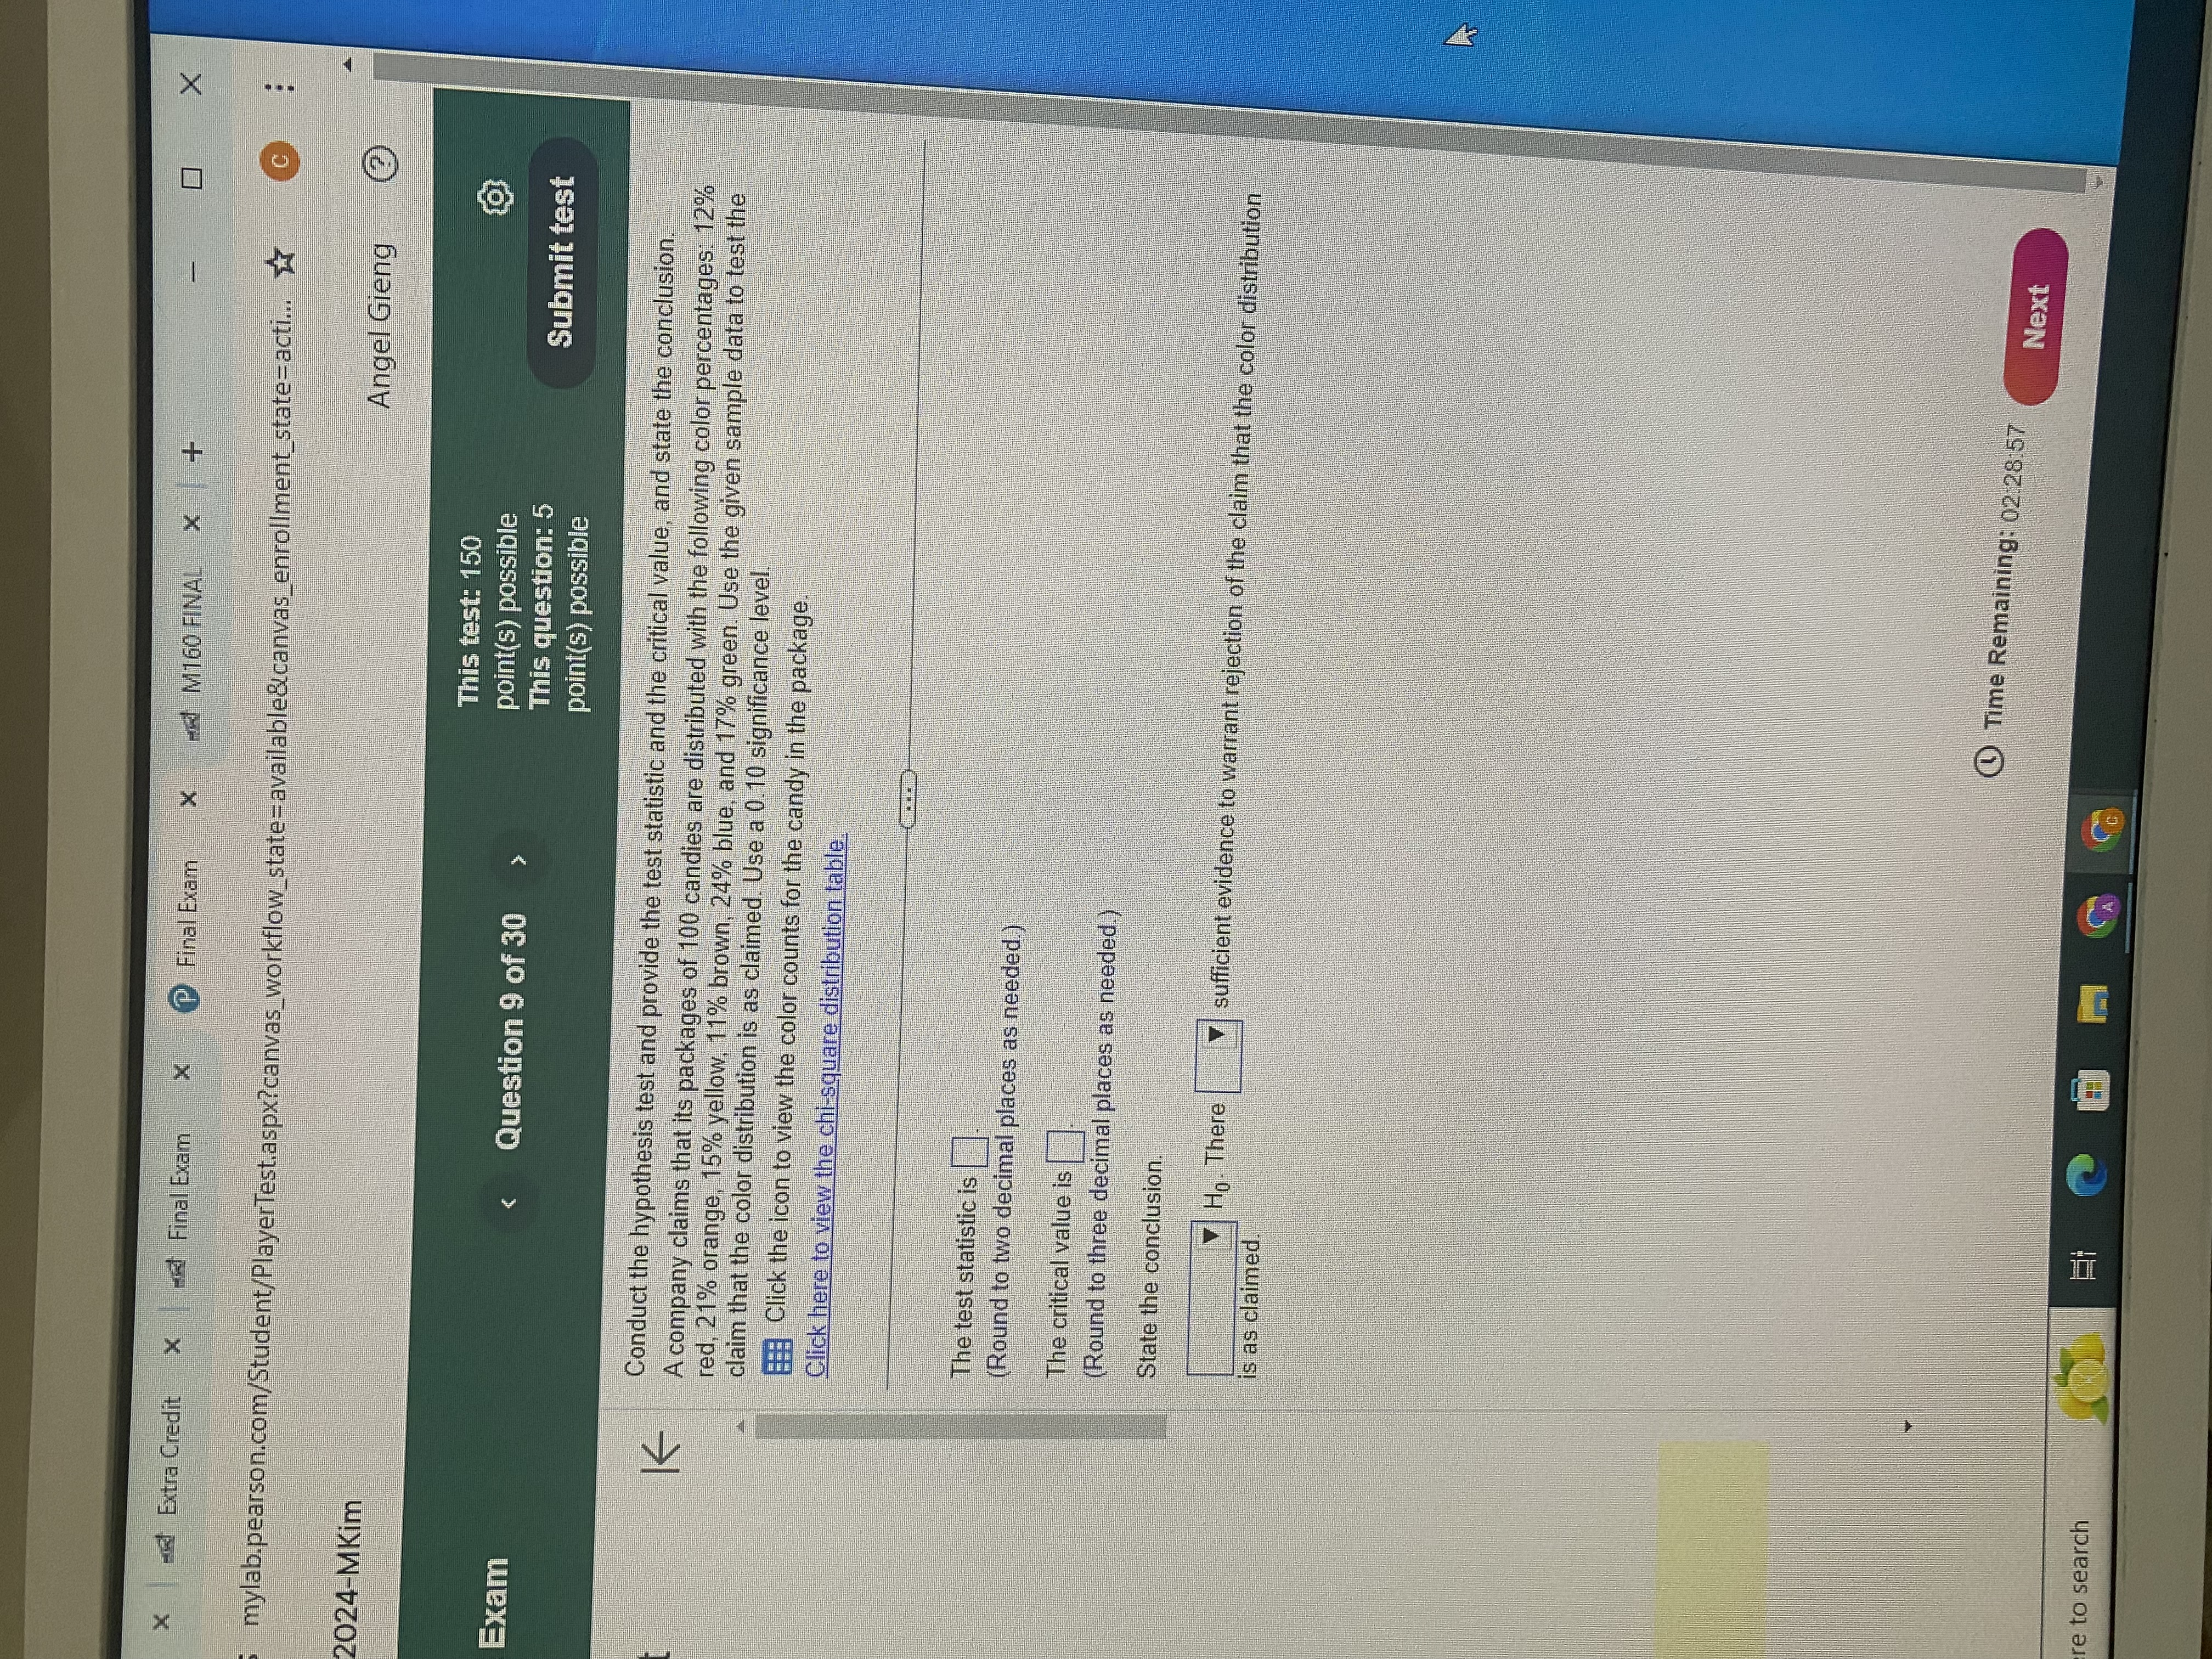
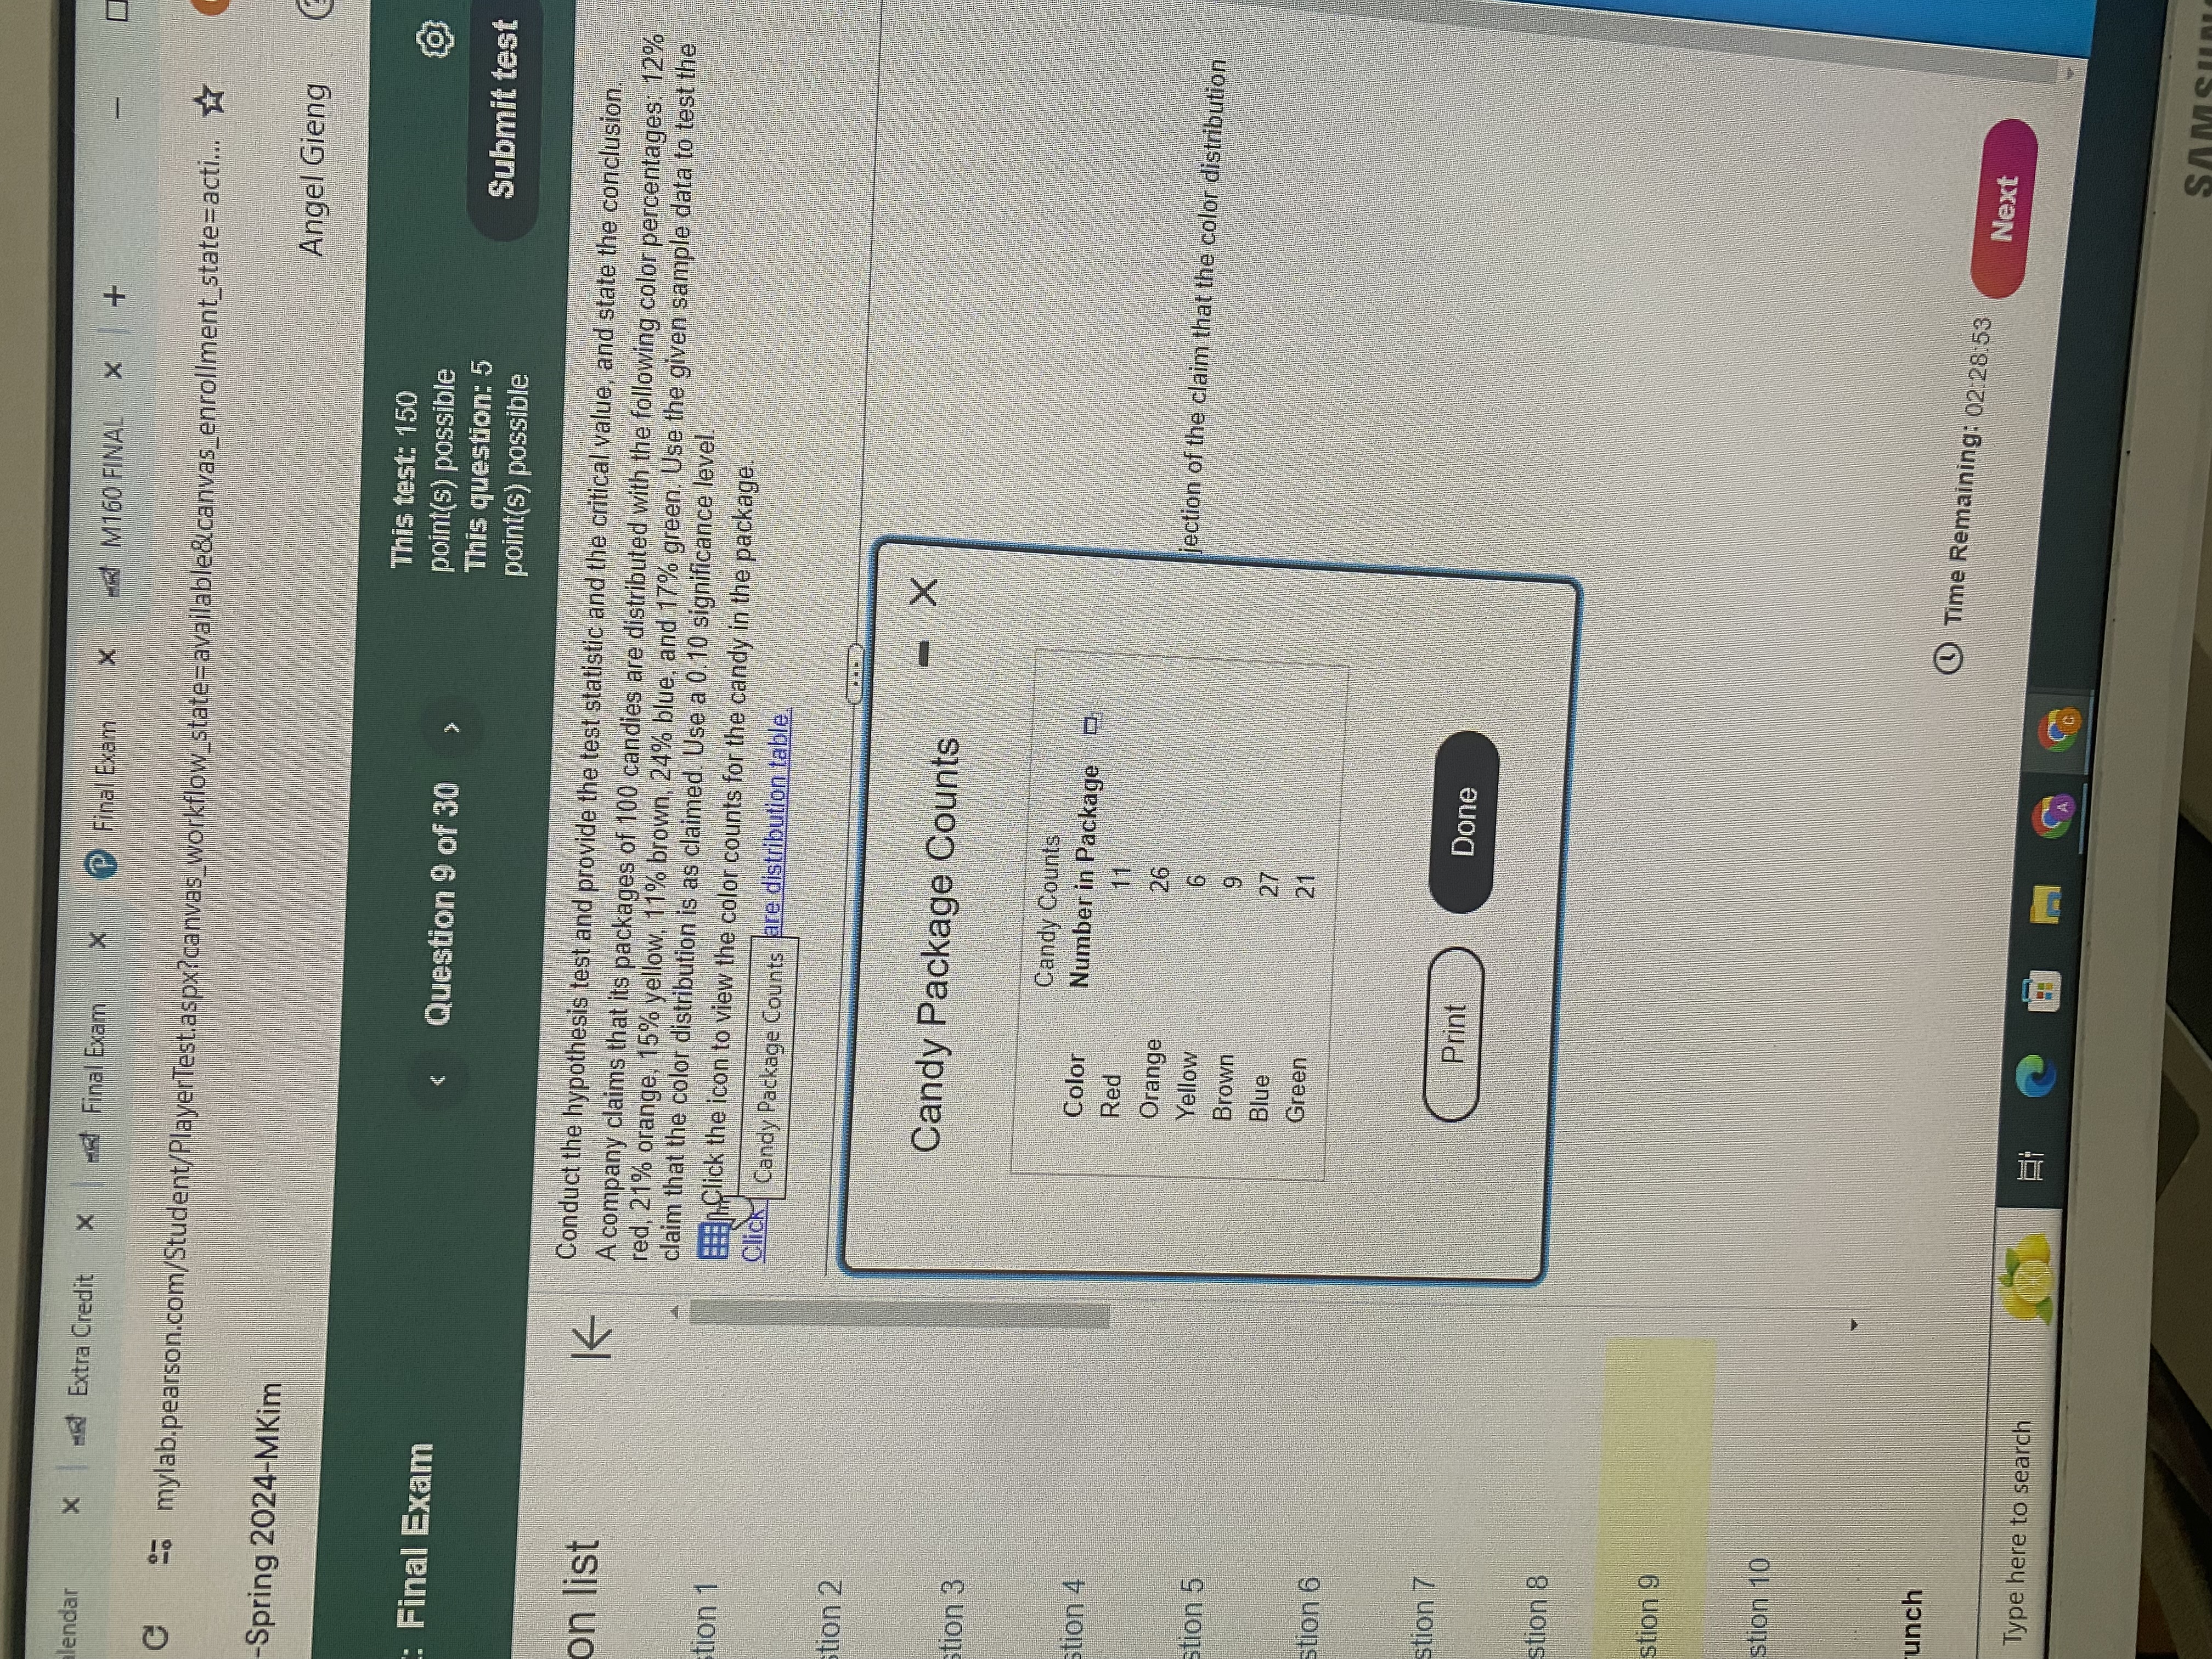
X - Extra Credit X Final Exam mylab.pearson.com/Student/PlayerTest.aspx? canvas_workflow_state = available8(canvas_enrollment_state=acti... Angel Gieng 2024-MKim This test: 150 point(s) possible Exam point(s) possible This question: 5 Submit test point(s) possible K A survey found that women's heights are normally distributed with mean 62.2 in, and standard deviation 2.2 in. The survey also found that men's heights are normally distributed with mean 68.2 in. and standard deviation 3.4 in. Most of the live characters employed at an amusement park have height requirements of a minimum of 55 in. and a maximum of 62 in. Complete parts (a) and (b) below a. Find the percentage of men meeting the height requirement. What does the result suggest about the genders of the people who are employed as characters at the amusement park? The percentage of men who meet the height requirement is |% Round to two decimal places as needed.) Since most men the height requirement, it is likely that most of the characters are b. If the height requirements are changed to exclude only the tallest 50% of men and the shortest 5% of men, what are the new height requirements? The new height requirements are a minimum of | in, and a maximum of (Round to one decimal place as needed.) | in. 10 Time Remaining: 02Extra Credit x a Final Exam X Final Exam X RM160 FINAL pearson.com/Student/PlayerTest.aspx?canvas_workflow_state=available&canvas_enrollment_state-acti... * C Kim Angel Gieng This test: 150 Question 2 of 30 point(s) possible This question: 5 Submit test point(s) possible K Listed below are the numbers of hurricanes that occurred in each year in a certain region. The data are listed in order by year. Find the range, variance, and standard deviation for the given sample data. Include appropriate units in the results. What important feature of the data is not revealed by any of the measures of variation? 2 10 13 The range of the sample data is (Round to one decimal place as needed.) The standard deviation of the sample data is (Round to one decimal place as needed.) The variance of the sample data is (Round to one decimal place as needed.) What important feature of the data is not revealed through the different measures of variation? O A. The measures of variation reveal nothing about how the numbers of hurricanes are spread. O B. The measures of variation do not reveal the difference between the largest number of hurricanes and the smallest number of hurricanes in the data. O C. The measures of variation reveal nothing about the pattern over time. O D. The measures of variation reveal no information about the scale of the data. Time Remaining: 02 29:38 Next earchan Extra Credit Final Exam P Final Exam X ylab.pearson.com/Student/PlayerTest.aspx? canvas_workflow_state=available&canvas_enrollment_state=acti... > 4-MKim Angel Gieng This test: 150 am Question 3 of 30 point(s) possible This question: 5 Submit test point(s) possible K Refer to the accompanying data display that results from a sample of airport Tinterval data speeds in Mbps. Complete parts (a) through (c) below. (13.046, 22.15) Click the icon to view a t distribution table. x = 17.598 Sx = 16.01712719 n =50 a. What is the number of degrees of freedom that should be used for finding the critical value to/2? of = (Type a whole number.) b. Find the critical value to/2 corresponding to a 95% confidence level. ta/2 - (Round to two decimal places as needed.) c. Give a brief general description of the number of degrees of freedom A. The number of degrees of freedom for a collection of sample data is the number of sample values that can vary after certain restrictions have been imposed on all data values. O B. The number of degrees of freedom for a collection of sample data is the total number of sample values. C. The number of degrees of freedom for a collection of sample data is the number of sample values that are determined after certain restrictions have been imposed on all data values. O D. The number of degrees of freedom for a collection of sample data is the number of unique, non- repeated sample values. Time Remaining: 02:29:33 /Player/Player.aspx?cultureid.. Next to searchExtra Credit X d Final Exam Final Exam 4160 FINAL 20 mylab.pearson.com/Student/PlayerTest.aspx? canvas_workflow_state=available&(canvas_enrollment_state=acti... C g 2024-MKim Angel Gieng This test: 150 al Exam Question 4 of 30 point(s) possible This question: 5 Submit test point(s) possible Find the area of the shaded region. The graph to the right depicts IQ scores st of adults, and those scores are normally distributed with a mean of 100 and a standard deviation of 15. Click to view page 1 of the table. Click to view page 2 of the table. The area of the shaded region is . (Round to four decimal places as needed.) 10 Time Remaining: 02:29:23 Next here to search DEETM160 FINAL X X we Extra Credit X met Final Exam Final Exam available& canvas_enrollment_state=acti... C mylab.pearson.com/Student/PlayerTest.aspx?canvas_workflow_state=a g 2024-MKim Angel Gieng This test: 150 al Exam Question 5 of 30 point(s) possible This question: 5 Submit test point(s) possible Based on a survey, assume that 42% of consumers are comfortable having drones deliver their purchases. st Suppose that we want to find the probability that when six consumers are randomly selected, exactly three of them are comfortable with delivery by drones Identify the values of n, x. p, and q. The value of n is (Type an integer or a decimal. Do not round. The value of x is (Type an integer or a decimal. Do not round. The value of p is (Type an integer or a decimal. Do not round.) The value of q is (Type an integer or a decimal. Do not round 10 Time Remaining: 02 29:20 Next here to searchX wel Extra Credit x med Final Exam al Exam 2 mylab.pearson.com/Student/PlayerTest.aspx? canvas_work 2024-MKim Angel Gieng This test: 150 l Exam point(s) possible This question: 5 Submit test point(s) possible In an experiment, college students were given either four quarters or a $1 bill and they could either keep the st money or spend it on gum. The results are summarized in the table. Complete parts (a) through (c) below. Purchased Gum Kept the Money Students Given Four Quarters 30 11 Students Given a $1 Bill 19 33 a. Find the probability of randomly selecting a student who spent the money, given that the student was given a $1 bill. The probability is Round to three decimal places as needed. b. Find the probability of randomly selecting a student who kept the money, given that the student was given a $1 bill. The probability is Round to three decimal places as needed. c. What do the results of parts a and b suggest? O A. A student given a $1 bill is more likely to have spent the money than to have kept the money O B. A student given a $1 bill is more likely to have kept the money than to have spent the money O C. A student given a $1 bill is more likely to have kept the money than a student given four quarters D. A student given a $1 bill is more likely to have spent the money than a student given four quarters. Time Remaining: 02-29:16 Next ere to searchExtra Credit wat Final Exam x @ Fing ) Exam 2% mylab.pearson.com/Student/PlayerTest.aspx?canvas_workfl g 2024-MKim Angel Gieng This test: 150 al Exam Question 7 of 30 point(s) possible This question: 5 Submit test point(s) possible The test statistic of z = - 1.63 is obtained when testing the claim that p # 0.183. This is a two-tailed test. Using a K 0.05 significance level, complete parts (a) and (b) Click here to view the standard normal distribution table for negative z scores. Click here to view the standard normal distribution table for positive z scores a. Find the critical value(s) Select the correct choice below and fill in the answer box(es) within your choice. (Round to two decimal places as needed.) DA. There is one critical value; the critical value is O B. . There are two critical values, the lower critical value is and the upper critical value is b. Should we reject Ho or should we fail to reject H, ? O A. Ho should not be rejected, since the test statistic is not in the critical region. O B. Ho should be rejected, since the test statistic is in the critical region. O C. He should be rejected, since the test statistic is not in the critical region. O D. He should not be rejected, since the test statistic is in the critical region Time Remaining: 02 29:12 Next here to searchX ar x Extra Credit me Final Exam Final Exam - M160 FINAL 25 mylab.pearson.com/Student/PlayerTest.aspx?canvas_workflow_state=available&canvas_enrollment_state=acti... * C ring 2024-MKim Angel Gieng This test: 150 inal Exam -Spring 2024-MKim Angel Gieng This test: 150 Final Exam Question 9 of 30 > point(s) possible This question: 5 Submit test point(s) possible Conduct the hypothesis test and provide the test statistic and the critical value, and state the conclusion. on list K A company claims that its packages of 100 candies are distributed with the following color percentages: 12% ed, 21% orange. 15% yellow, 11% brown, 24% blue, and 17% green. Use the given sample data to test the claim that the color distribution is as claimed. Use a 0.10 significance level. tion 1 FEClick the icon to view the color counts for the candy in the package Click Candy Package Counts are distribution table. stion 2 X Candy Package Counts stion 3 Candy Counts stion 4 Color Number in Package Red Orange Yellow lection of the claim that the color distribution stion 5 Brown Blue NN6 Green stion 6 stion 7 Print Done stion 8 stion 9 stion 10 unch Time Remaining: 02:28:53 Next Type here to search CAX Extra Credit X wed Final Exam @ Final Exam acti... C 25 mylab.pearson.com/Student/PlayerTest.aspx? canvas_workflow_state g 2024-MKim Angel Gieng This test: 150 Question 10 of 30 point(s) possible al Exam This question: 5 Submit test point(s) possible ist
Step by Step Solution
There are 3 Steps involved in it

Get step-by-step solutions from verified subject matter experts