

Question: x Final - Chapter 1 to 12 (page 12 . x Course: SCI-1001 - 91715 - Hum: x + ambriancollege.ca/mod/quiz/attempt.php?attempt=2010797&cmid=1722930&page=11 BRIAN LEGE Student Resources Faculty
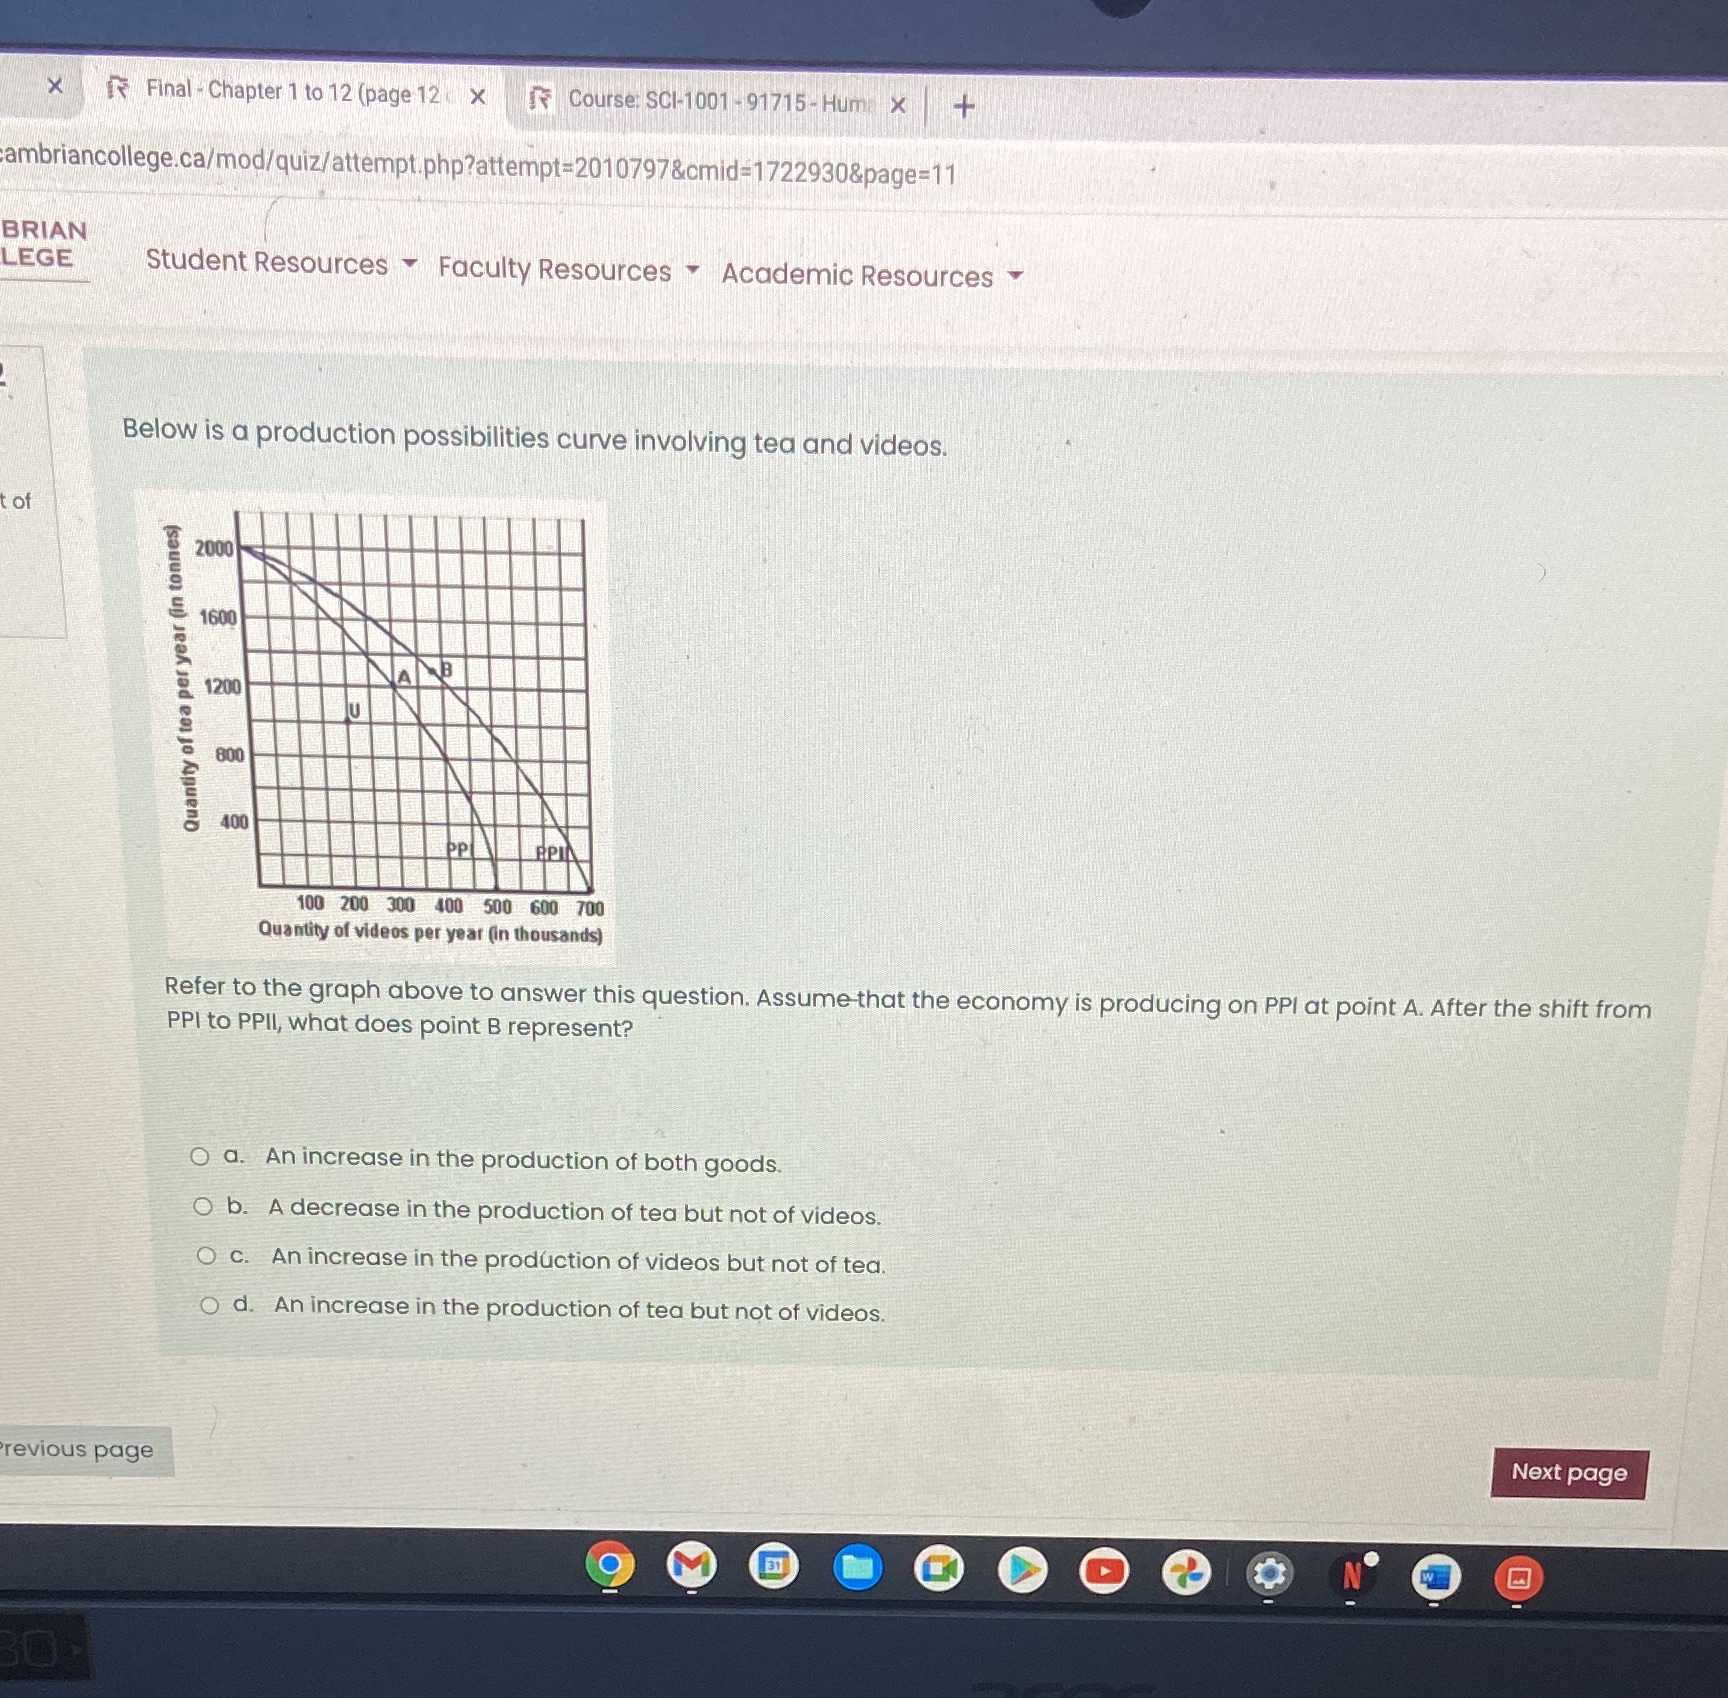
x Final - Chapter 1 to 12 (page 12 . x Course: SCI-1001 - 91715 - Hum: x + ambriancollege.ca/mod/quiz/attempt.php?attempt=2010797&cmid=1722930&page=11 BRIAN LEGE Student Resources Faculty Resources Academic Resources Below is a production possibilities curve involving tea and videos. t of 1600 Quantity of tea per year (in tonnes) 1200 800 100 200 300 400 500 600 700 Quantity of videos per year (in thousands) Refer to the graph above to answer this question. Assume that the economy is producing on PPI at point A. After the shift from PPI to PPII, what does point B represent? O a. An increase in the production of both goods. O b. A decrease in the production of tea but not of videos. O c. An increase in the production of videos but not of tea. O d. An increase in the production of tea but not of videos. Previous page Next page
Step by Step Solution
There are 3 Steps involved in it

Get step-by-step solutions from verified subject matter experts