

Question: - X i Data Table (Click on the following icon in order to copy its contents into a spreadsheet.) States Boom Normal Recession Probability 27%
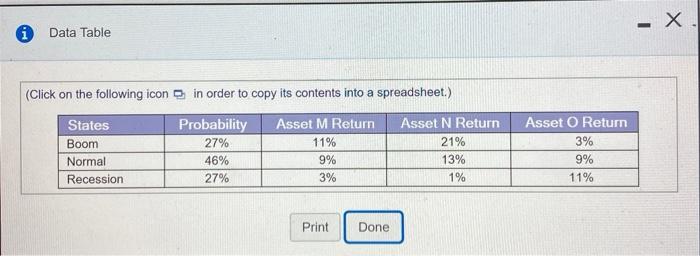
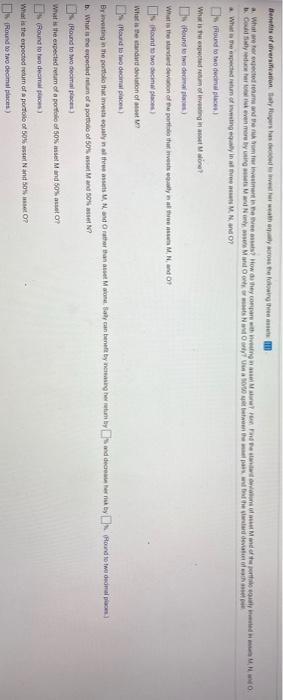

- X i Data Table (Click on the following icon in order to copy its contents into a spreadsheet.) States Boom Normal Recession Probability 27% 46% 27% Asset M Return 11% 9% 3% Asset N Return 21% 13% 1% Asset O Return 3% 9% 11% Print Done Benefits of verificatoare de verwartowing the a. What we rected and investment in the vee How do they come thing we de window Odder even more way. May and the deve What the expected emoting in MNO Es moud toodecim What is the speed of one Rond de With sweden of reportiva M N O oond to two decimi place What is the standard deviation of sound to two decimat piace) Brevesting in the promote that investiganly in the Mand Orther than asset Malone Bay can benade by nemaling bertan by suddet er nok by Hand to w domu b. What is the expected tom of a portfolio of 50% Mandos ? LhRound to wo decimal proces What is the expected retum of a portfolio of SOM and 50% Round to be deomal perom What is the expected to a poroloof 50% asset Nando? Round to two decimal slaces) What is the standard deviation of a portfolio of 50% asset M and 50% asset O? 1% (Round to two decimal places.) What is the standard deviation of a portfolio of 50% asset N and 50% asset O? % (Round to two decimal places.) Could Sally reduce her total risk even more by using assets M and N only, assets M and O only, or assets N and only? (Select the best response.) A. There is not enough information to answer this question. B. No, none of the portfolios using a 50-50 split reduce risk. OC. Yes, a portfolio of 50% of asset M and 50% of asset O could reduce the risk to 1.00% D. Yes, a portfolio of 50% of asset M and 50% of asset N could reduce the risk to 1.00%
Step by Step Solution
There are 3 Steps involved in it

Get step-by-step solutions from verified subject matter experts