

Question: X i Data Table (Click on the icon located on the top-right corner of the data table below in order to copy its contents into
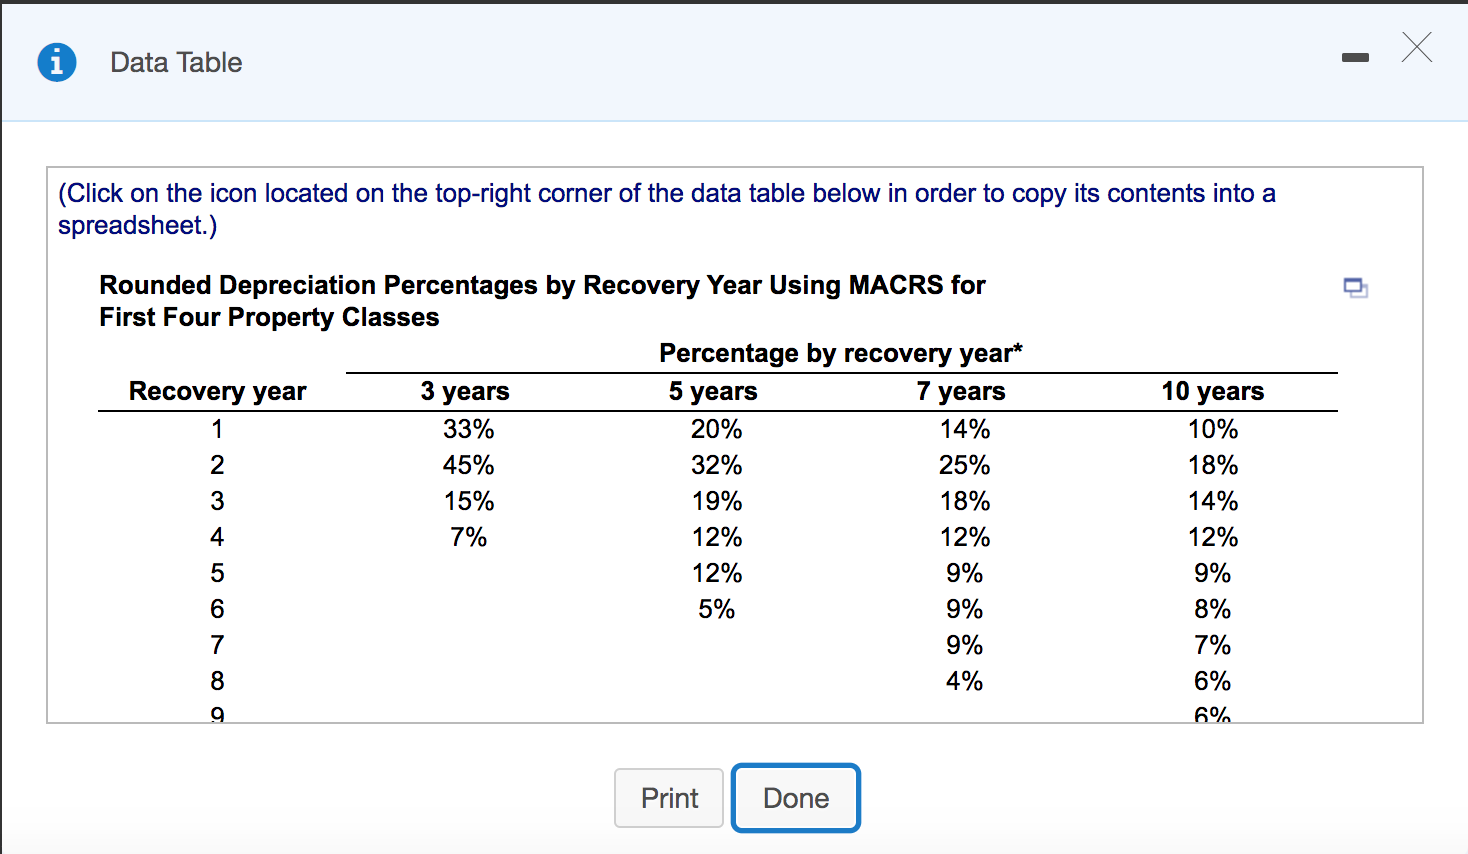
X i Data Table (Click on the icon located on the top-right corner of the data table below in order to copy its contents into a spreadsheet.) 10 years 10% 18% Rounded Depreciation Percentages by Recovery Year Using MACRS for First Four Property Classes Percentage by recovery year* Recovery year 3 years 5 years 7 years 1 33% 20% 14% 2 45% 32% 25% 3 15% 19% 18% 4 7% 12% 12% 5 12% 9% 6 5% 9% 7 9% 8 4% 14% 12% 9% 8% 7% 6% 6% Print Done
Step by Step Solution
There are 3 Steps involved in it
1 Expert Approved Answer
Step: 1 Unlock

Question Has Been Solved by an Expert!
Get step-by-step solutions from verified subject matter experts
Step: 2 Unlock
Step: 3 Unlock