

Question: x = linspace(-5,5,201); y = linspace(-5,5,201); U = [ 1 5 10 20]; a = [ 1 5 5 5]; r = x.^2+y.^2 theta =
x = linspace(-5,5,201);
y = linspace(-5,5,201);
U = [ 1 5 10 20];
a = [ 1 5 5 5];
r = x.^2+y.^2
theta = atan(y./x)
for k = 1:length(a)
for i = 1:length(r)
for j = 1:length(theta)
vr(i,j) =U(k)*((1))-((a(k)^2))/((r(i)^2))*cos(2*theta(j))
end
end
subplot(2,2,i)
quiver(x,y,vr,vt)
end
Can you help with the coding in part one I have gotten to this point know I dont know what im doing wrong
This code is in Matlab 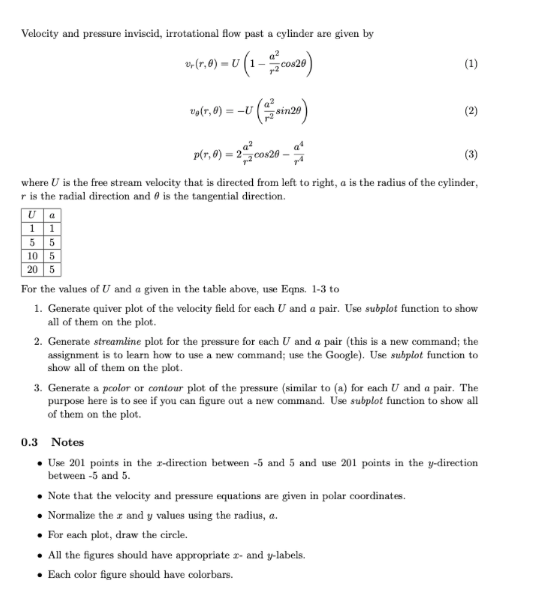
Velocity and pressure inviscid, irrotational flow past a cylinder are given by er(0,0) = 0 (1 - .co20) (1) U- = (8 ,) (2) pr, @) = 25. 00:20 (3) where U is the free stream velocity that is directed from left to right, a is the radius of the cylinder, r is the radial direction and 6 is the tangential direction 1 1 5 5 105 205 For the values of U and a given in the table above, use Egns. 1-3 to 1. Generate quiver plot of the velocity field for each U and a pair. Use subplot function to show all of them on the plot. 2. Generate streamline plot for the pressure for each U and a pair (this is a new command; the assignment is to learn how to use a new command; use the Google). Use subplot function to show all of them on the plot. 3. Generate a poolor or contour plot of the pressure (similar to (a) for each U and a pair. The purpose here is to see if you can figure out a new command. Use subplot function to show all of them on the plot. 0.3 Notes . Use 201 points in the 2-direction between -5 and 5 and use 201 points in the y-direction between -5 and 5. Note that the velocity and pressure equations are given in polar coordinates. Normalize the r and y values using the radius, a. . For each plot, draw the circle. All the figures should have appropriate r- and y-labels. Each color figure should have colorbars
Step by Step Solution
There are 3 Steps involved in it

Get step-by-step solutions from verified subject matter experts