

Question: X Statistical Tables Microsoft Word - Stat 161 Fall X Module 5 (page 21 of 22) X .f Chi-square Calculator X i + ti eclass.srvtua|bertatcai
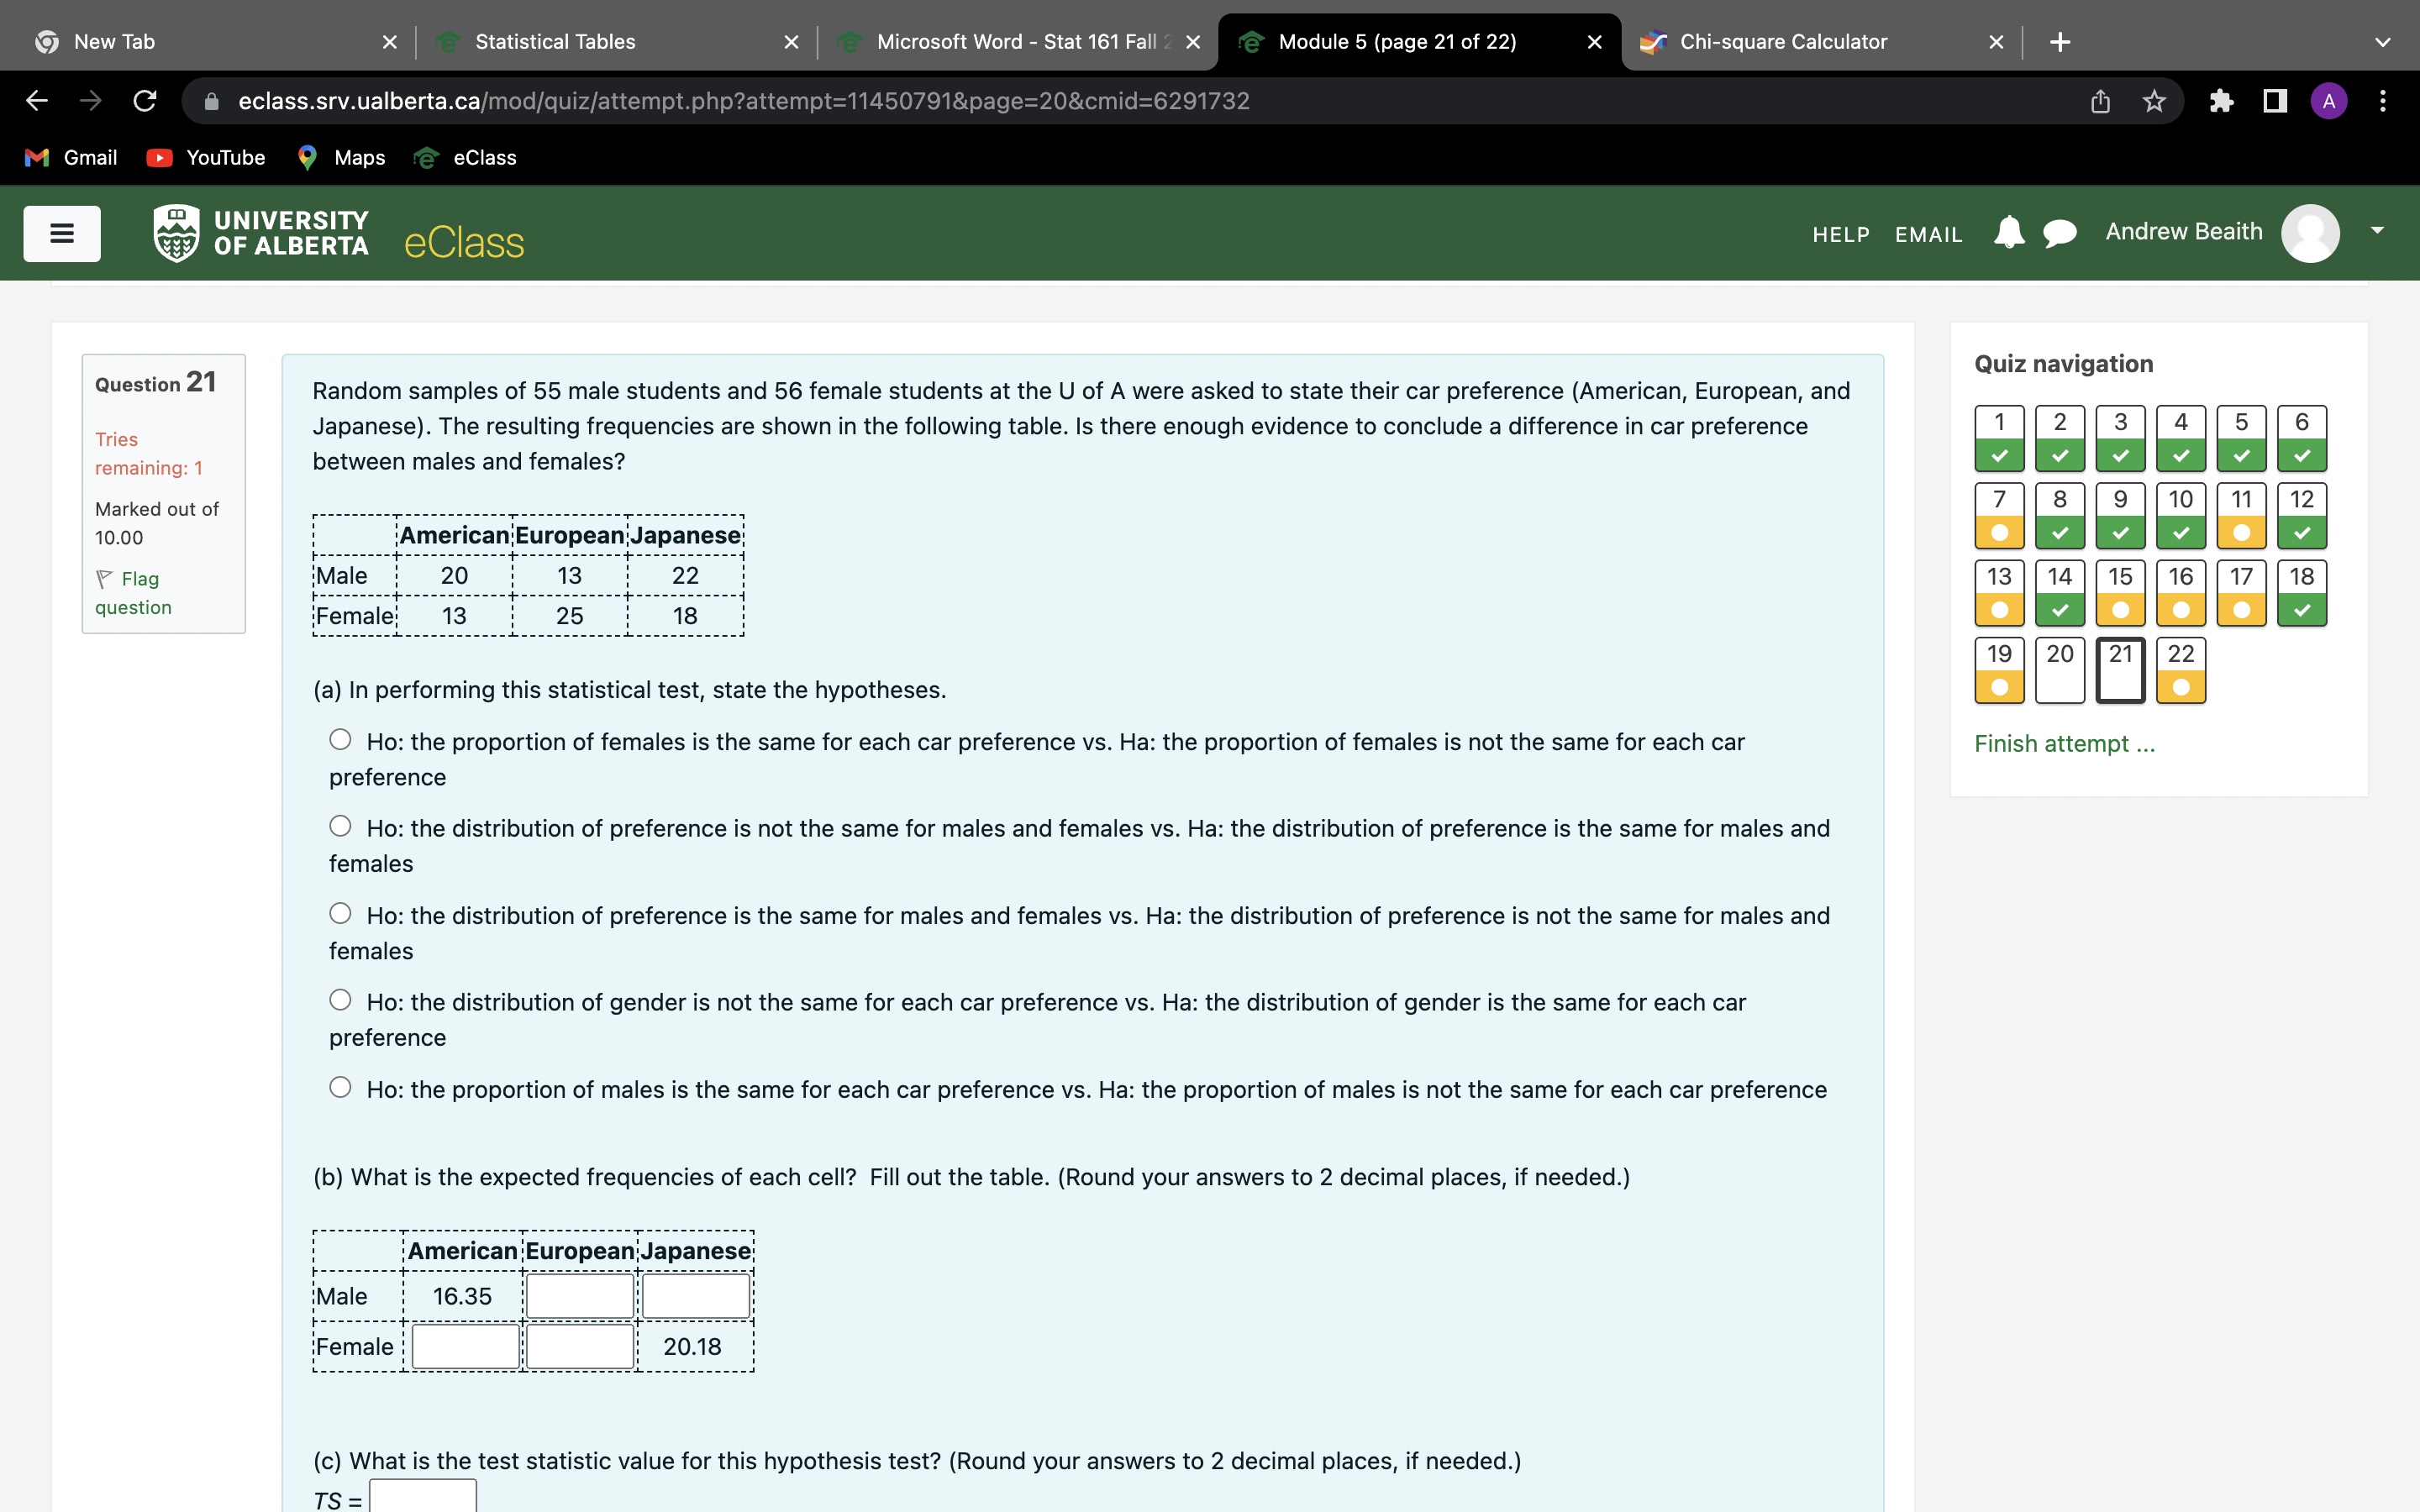
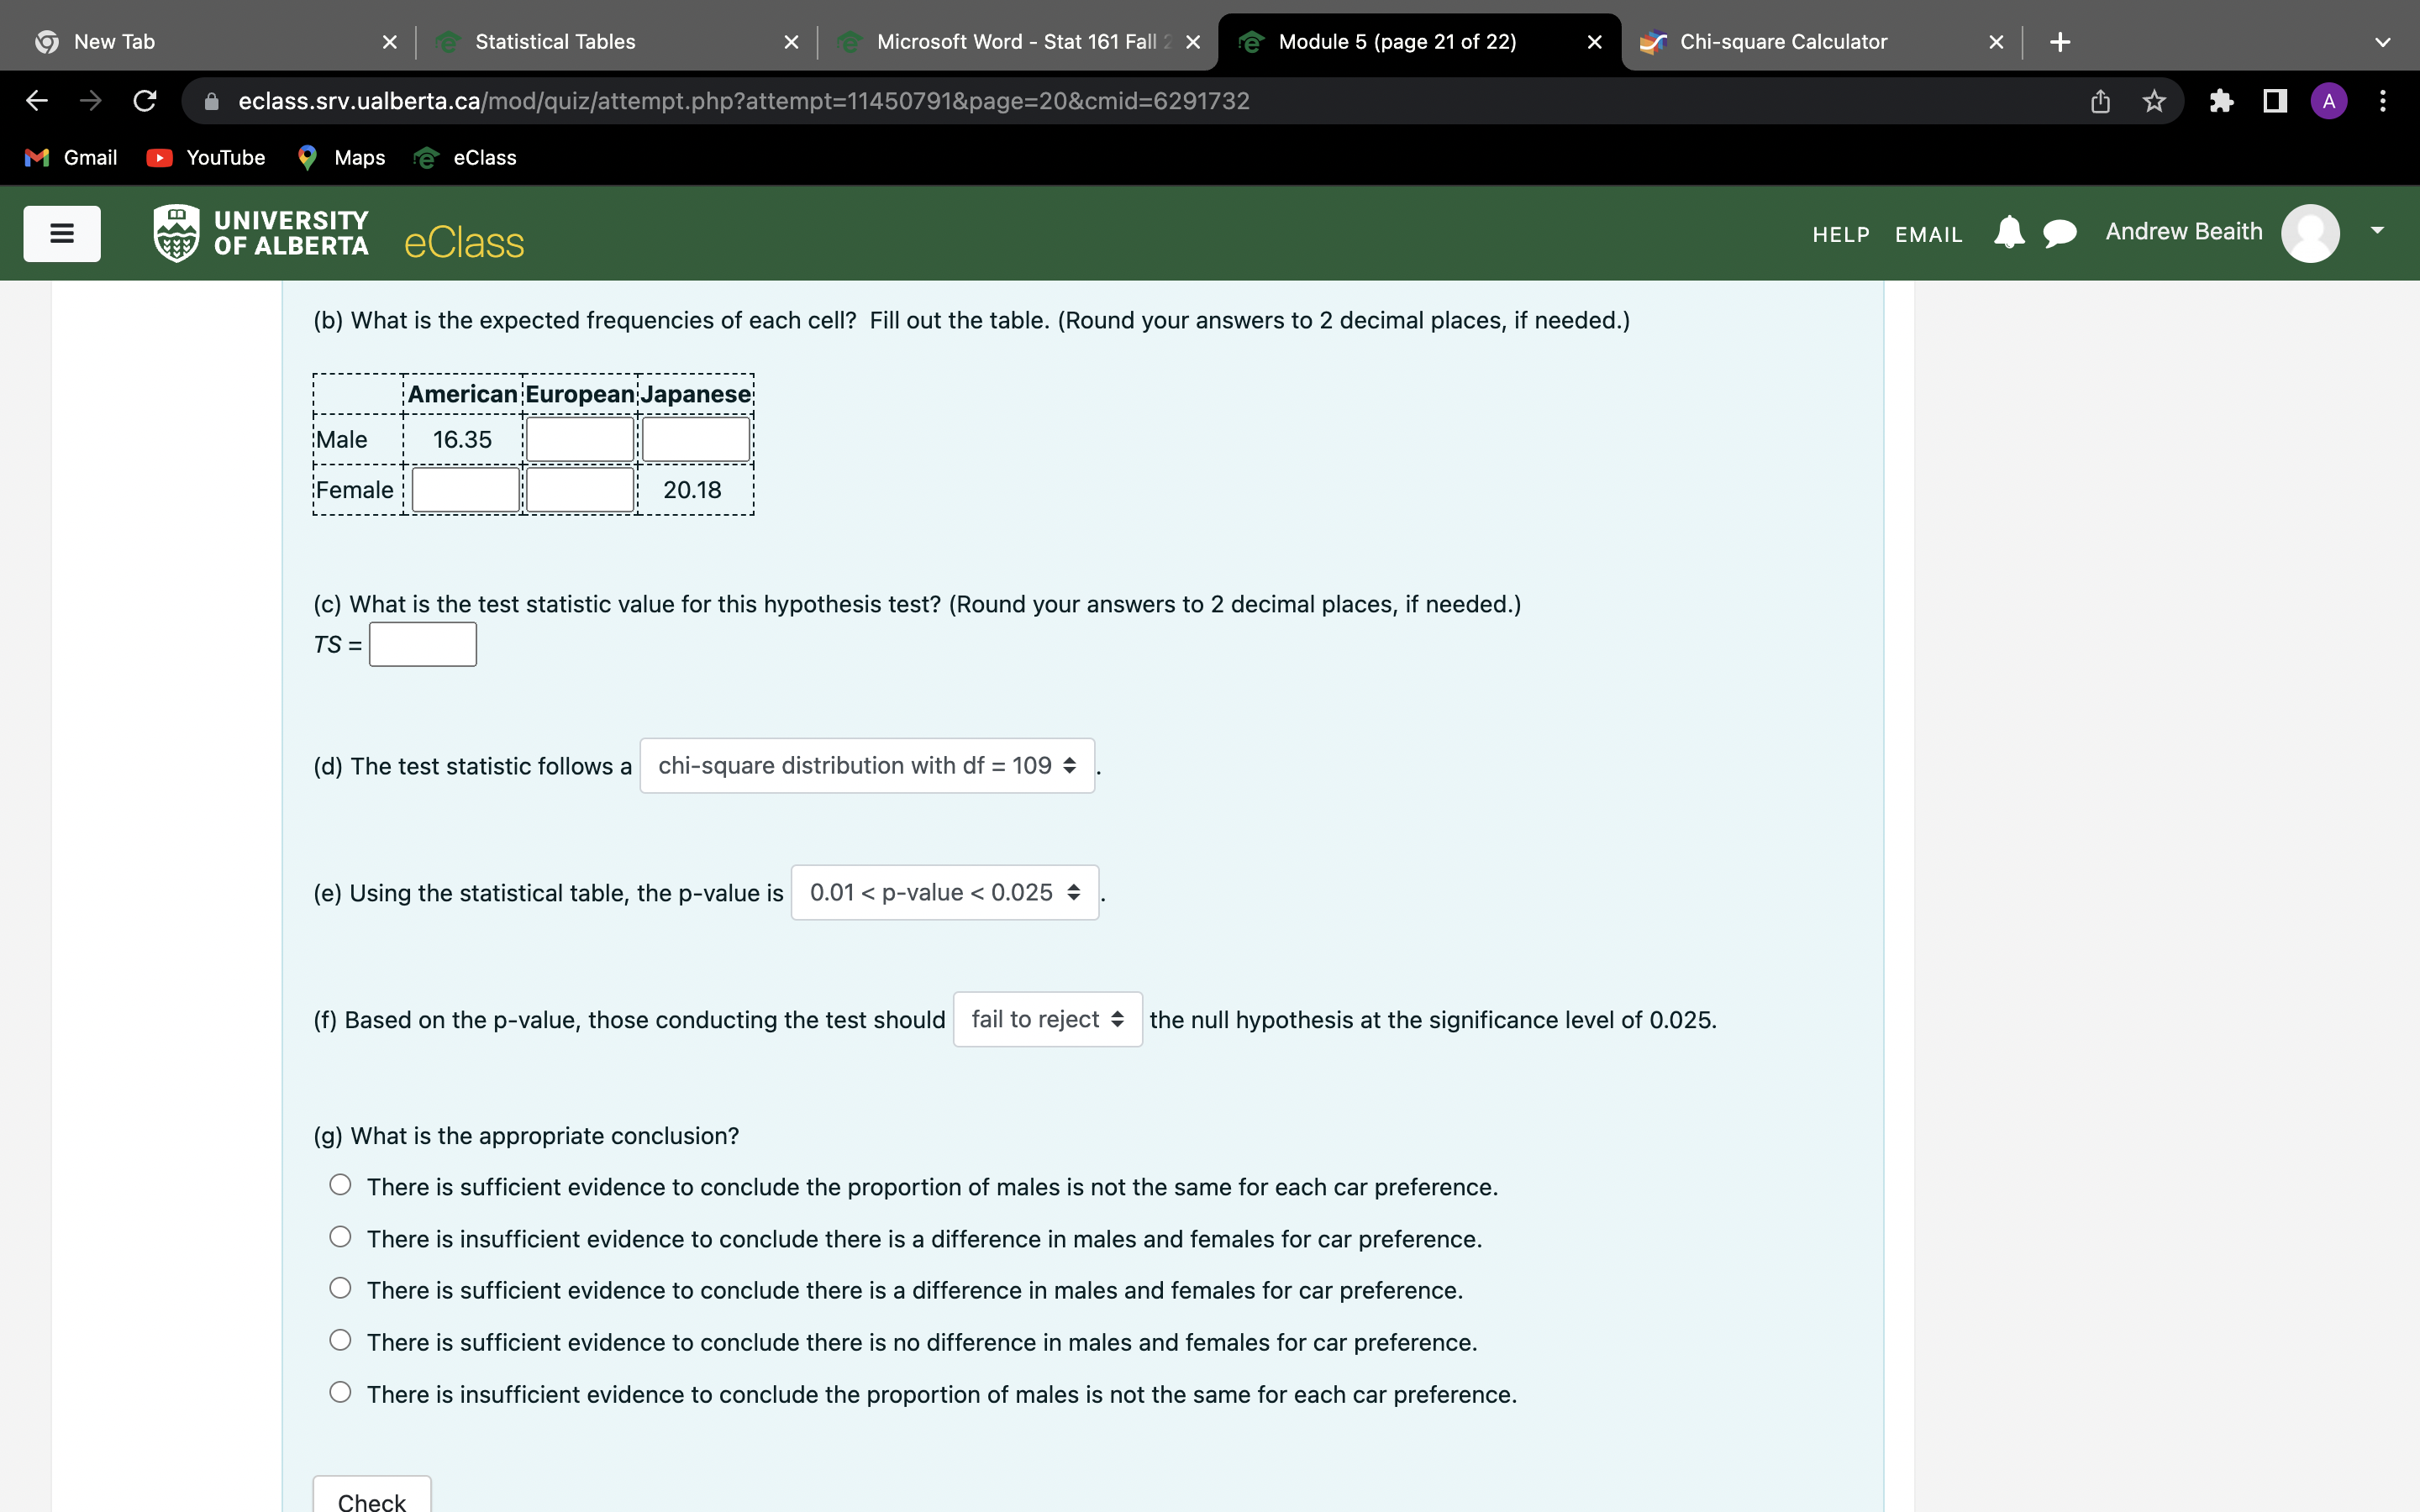
X Statistical Tables Microsoft Word - Stat 161 Fall X Module 5 (page 21 of 22) X .f Chi-square Calculator X i + ti eclass.srvtua|bertatcai u, ,, ' Gmail . YouTube 9 Maps eCIass UNIVERSITY a 'OFALBERTA eClass \"\"65\"\" 21 Random samples of 55 male students and 56 female students at the U of A were asked to state their car preference (American, European, and We: Japanese)' The resulting frequencies are shown in the following table' Is there enough evidence to conclude a difference in car preference 1 2 3 remaining 1 between males and females? 6 H d Marked out of 10.00 Email\" \\V Flag question (a) In performing this statistical test, state the hypotheses. 0 Ho: the proportion of females is the same for each car preference vs' Ha: the proportion of females is not the same for each car Finish attempt preference 0 Ho: the distribution of preference is not the same for males and females vs. Ha: the distribution of preference is the same for males and females O Ho: the distribution of preference is the same for males and females vs' Ha: the distribution of preference is not the same for males and females 0 Ho: the distribution of gender is not the same for each car preference vs. Ha: the distribution of gender is the same for each car preference 0 Ho: the proportion of males is the same for each car preference vs. He: the proportion of males is not the same for each car preference (b) What is the expected frequencies of each cell? Fill out the table. (Round your answers to 2 decimal places, if needed') iAmerica European apanese (c) What is the test statistic value for this hypothesis test? (Round your answers to 2 decimal places, if needed') m X Statistical Tables Microsoft Word - Stat 161 Fall X Module 5 (page 21 of 22) X .f Chi-square Calculator X i + i eclass.srvtualbertatcaw ' Gmail . YouTube 9 Maps eClass a '322'3'5543 eCIaSS HELP EMAIL ' , AndrewBeai (b) What is the expected frequencies of each cell? Fill out the table. (Round your answers to 2 decimal places, if needed') iAmerican:European apanese (d) The test statistic follows a chi-square distribution with df : 109 3 (e) Using the statistical table, the pvalue is 0.01
Step by Step Solution
There are 3 Steps involved in it

Get step-by-step solutions from verified subject matter experts