

Question: X VLM_Chapter_5_Project.pdf . .. 3. Here are five different functional models that might represent the growth of the number of Zika cases, where x represents
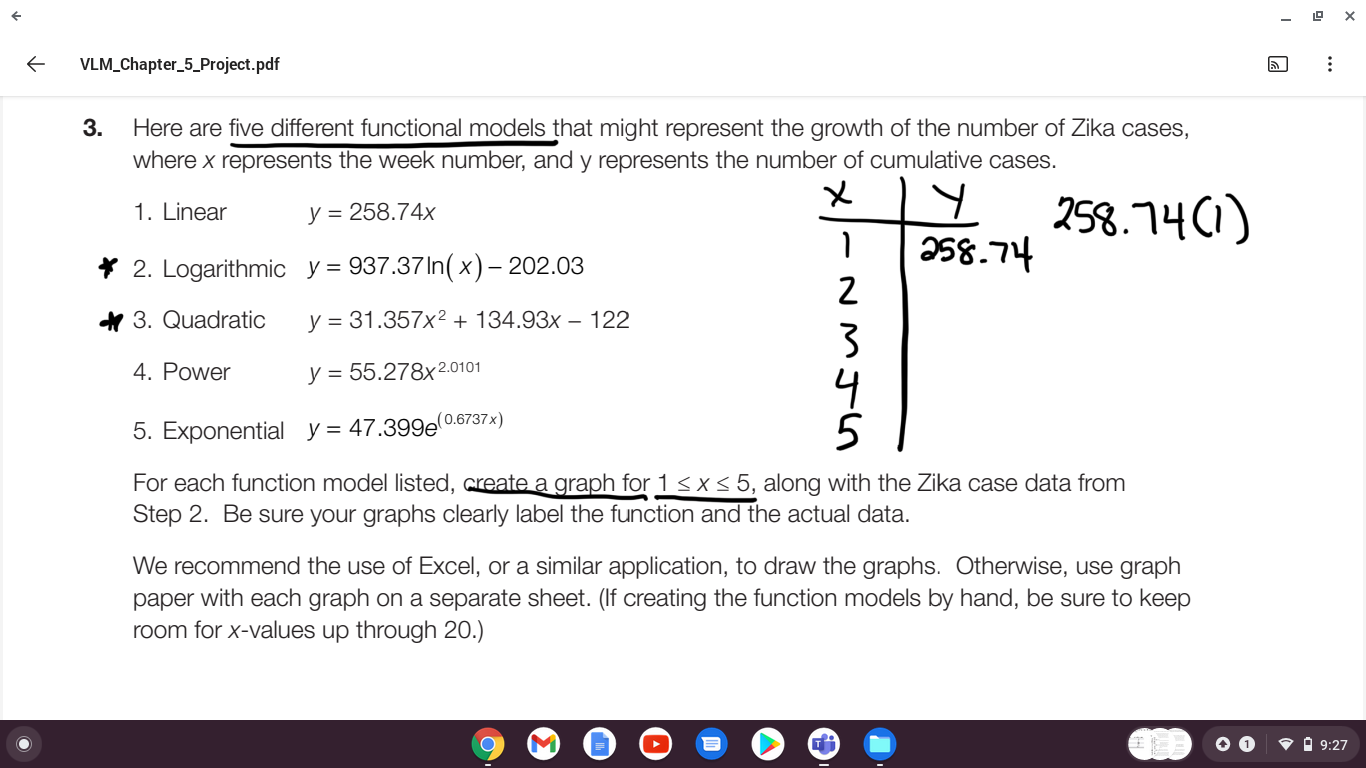
X VLM_Chapter_5_Project.pdf . .. 3. Here are five different functional models that might represent the growth of the number of Zika cases, where x represents the week number, and y represents the number of cumulative cases. 1. Linear X y = 258.74x y 258. 74 (1 ) * 2. Logarithmic y = 937.37In(x) - 202.03 258-74 4 3. Quadratic y = 31.357x2 + 134.93x - 122 USWN - 4. Power y = 55.278x 2.0101 5. Exponential y = 47.399e(0.6737x) For each function model listed, create a graph for 1 s x
Step by Step Solution
There are 3 Steps involved in it
1 Expert Approved Answer
Step: 1 Unlock

Question Has Been Solved by an Expert!
Get step-by-step solutions from verified subject matter experts
Step: 2 Unlock
Step: 3 Unlock