Question: X X ACCT503_Sample_Project_Template (2) v Search File Home Insert Page Layout Formulas Data Review View Automate Developer Help Power Pivot Comments Share ~ X Cut
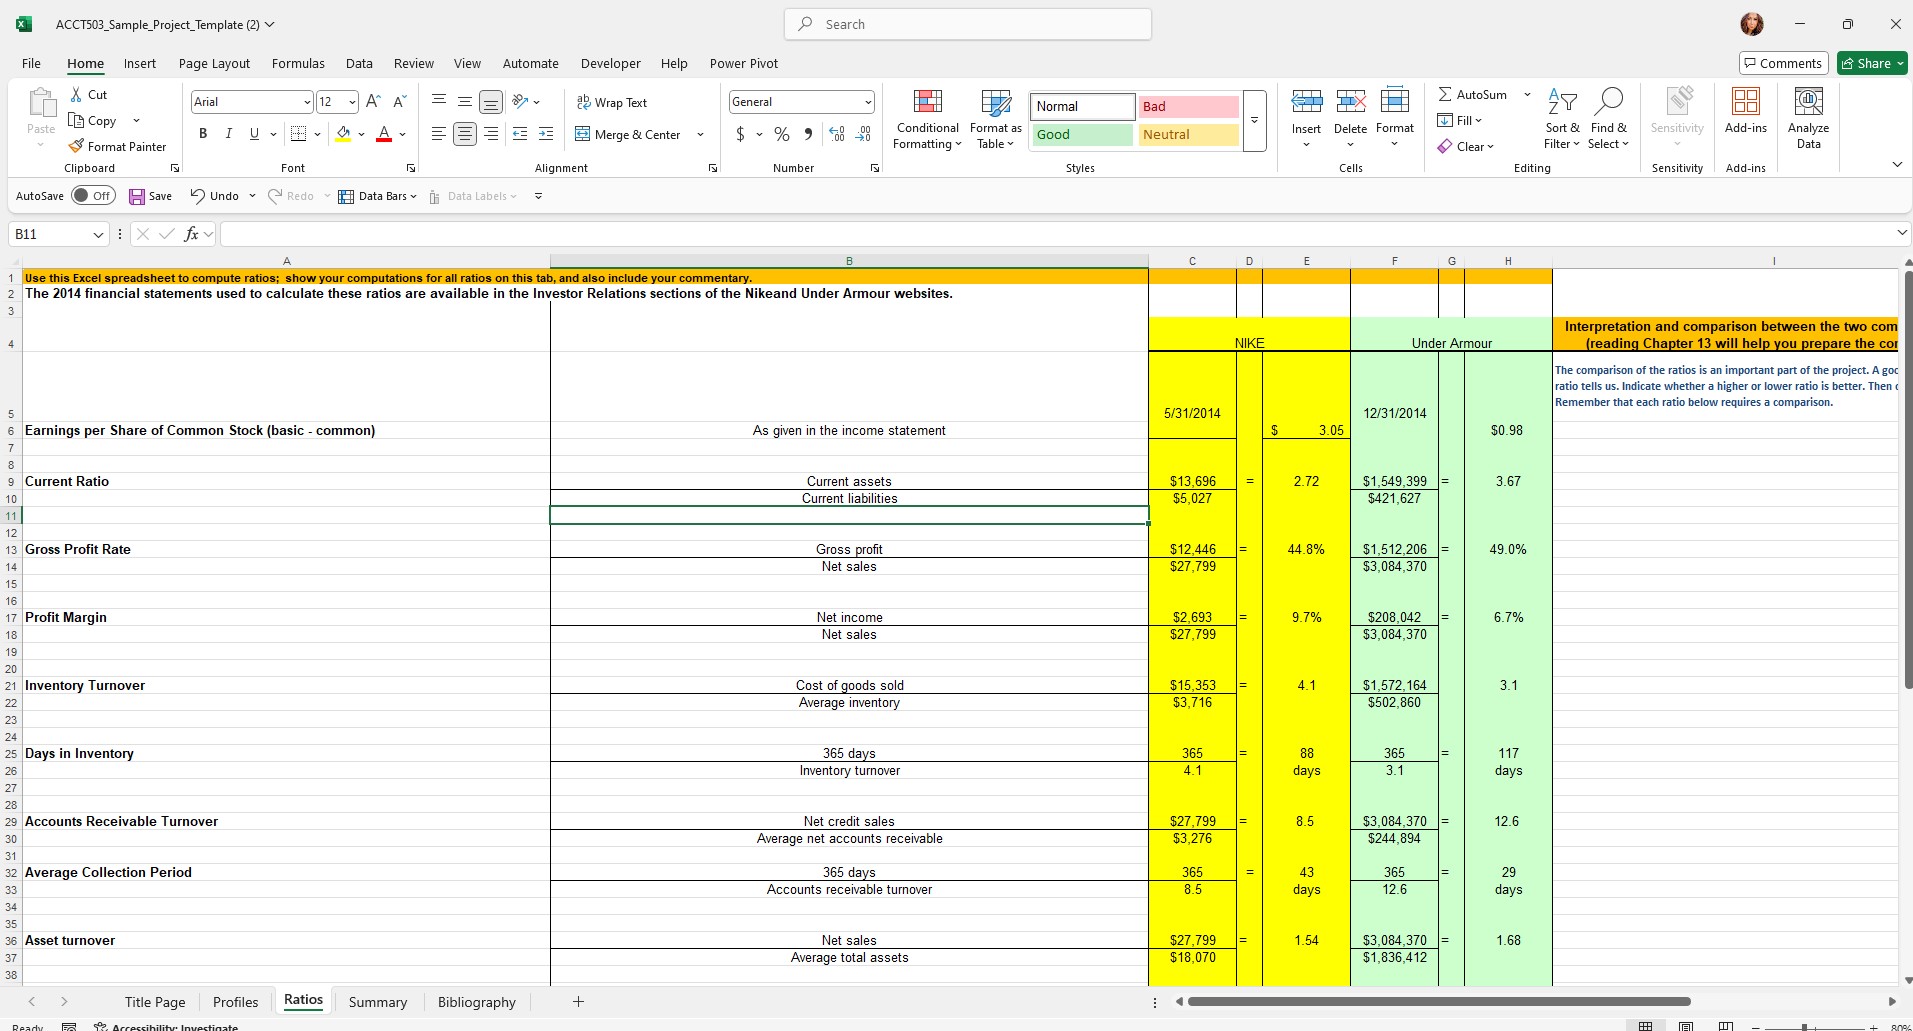
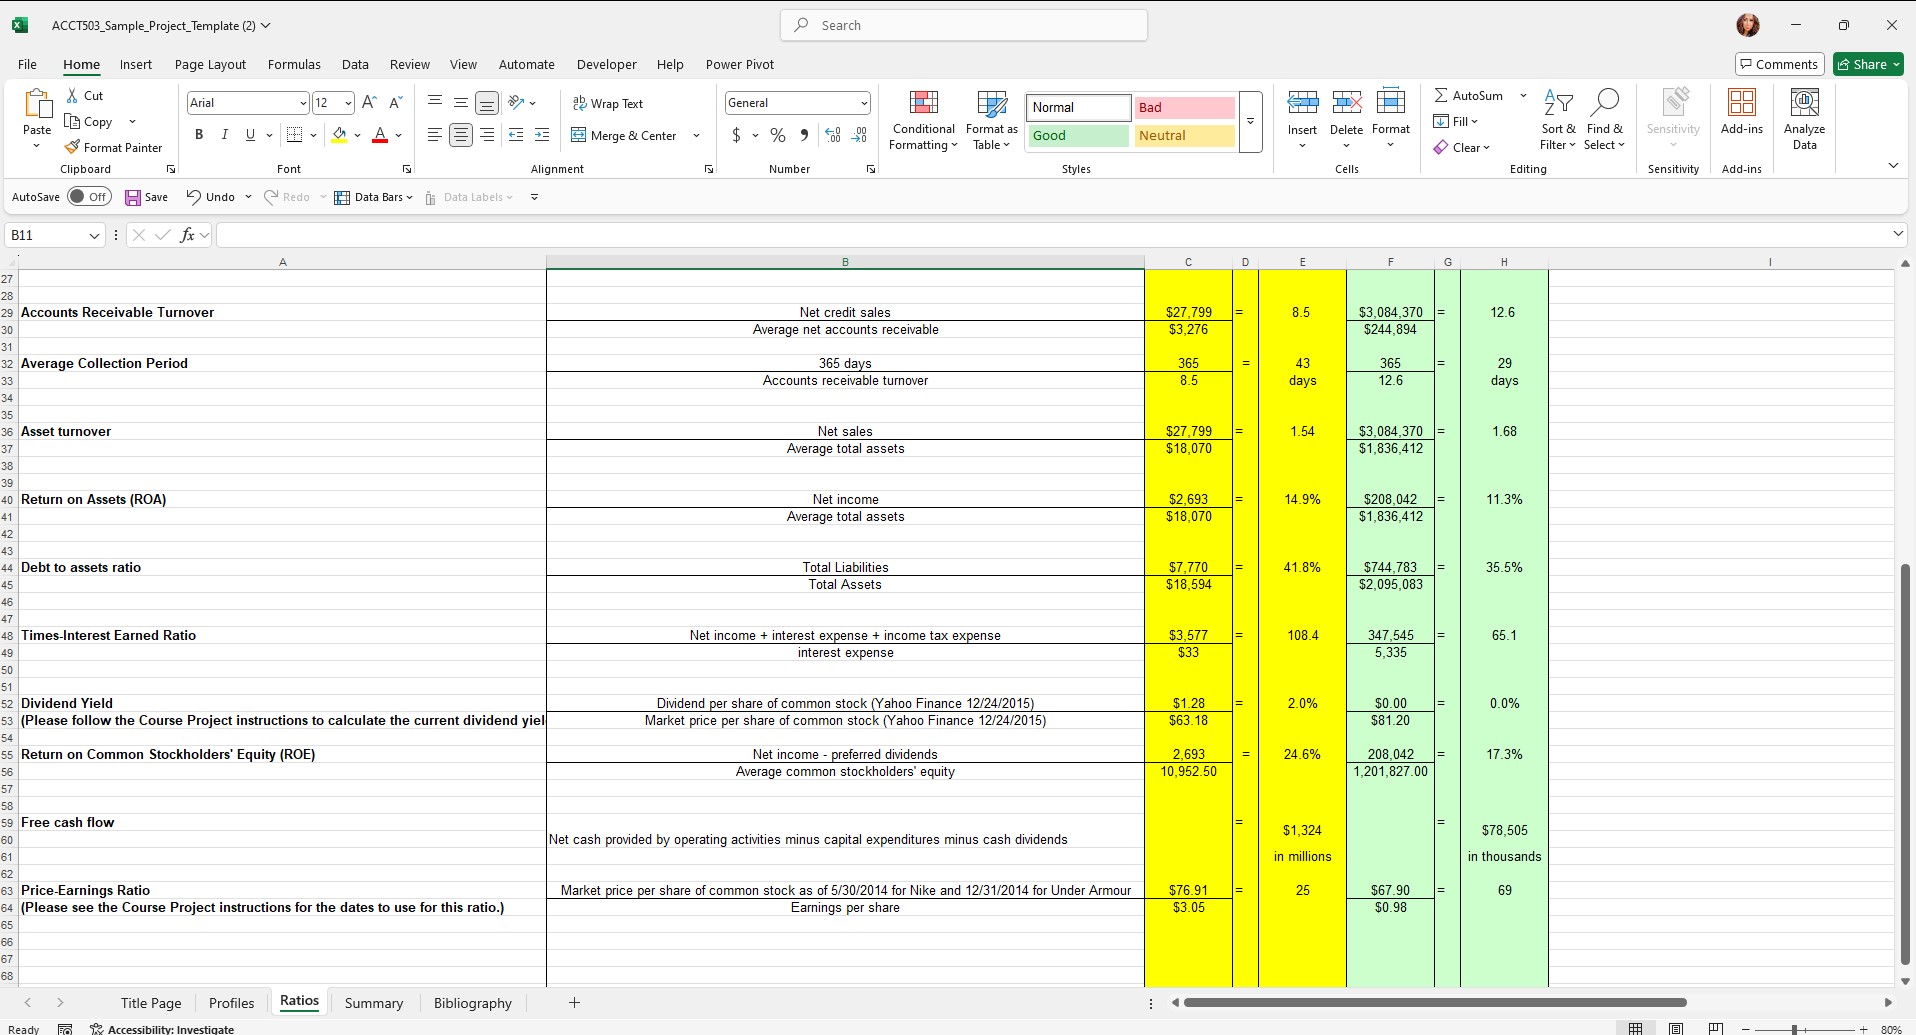
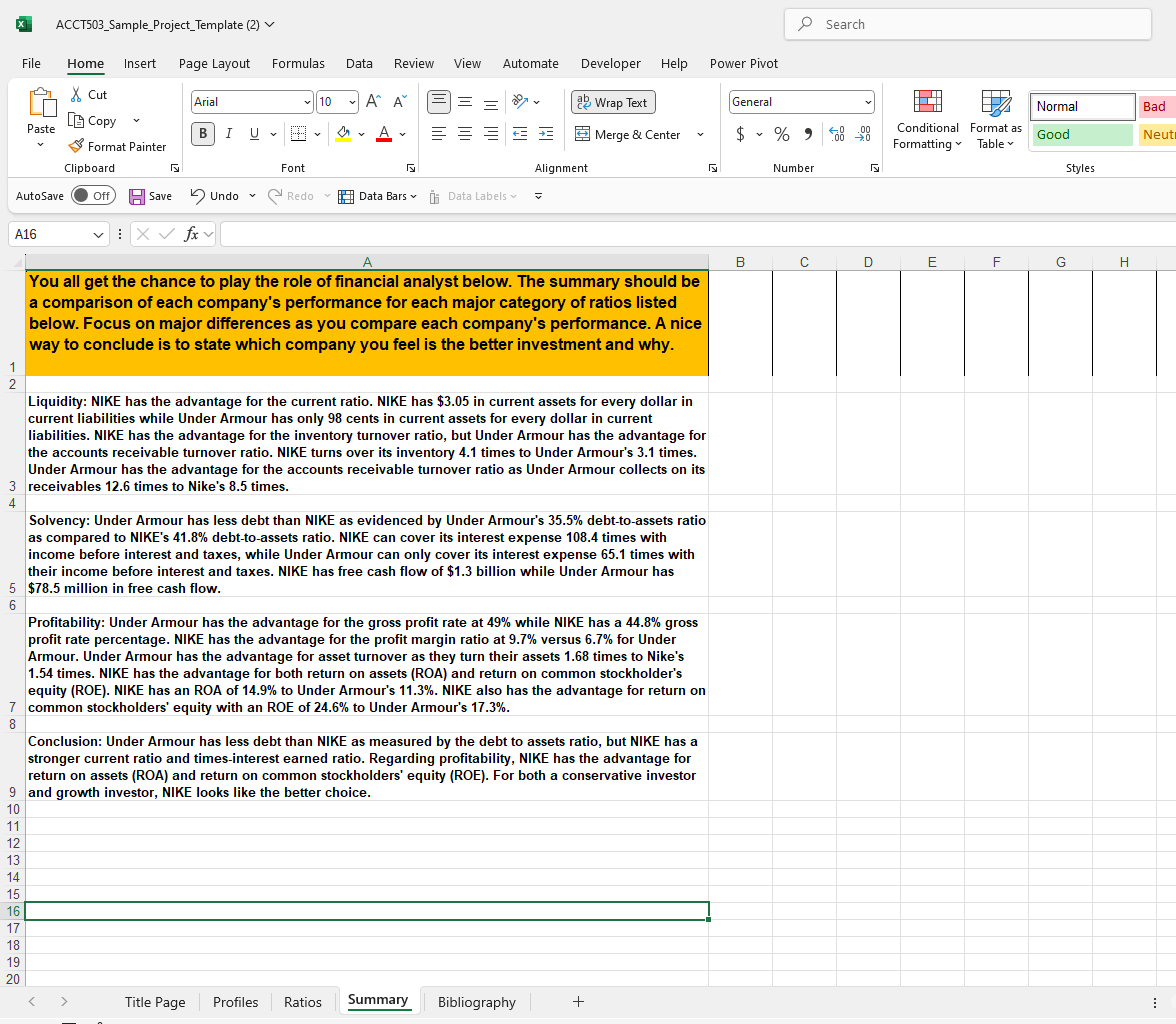
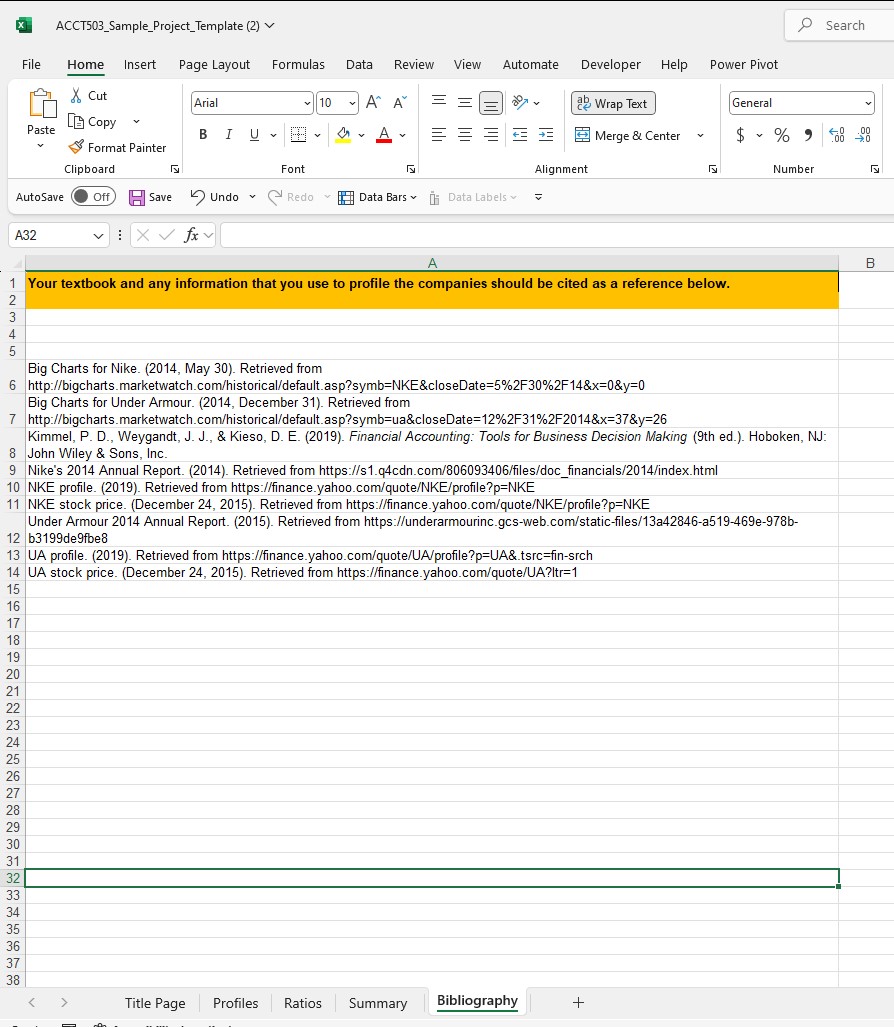
X X ACCT503_Sample_Project_Template (2) v Search File Home Insert Page Layout Formulas Data Review View Automate Developer Help Power Pivot Comments Share ~ X Cut _ AutoSum Arial 12 ~ A" A ab Wrap Text General Normal Bad AY O OC Insert Delete Format Fill Paste LB Copy Merge & Center Conditional Format as Sort & Find & Sensitivity Add-ins Analyze BIUVA % " 30 Good Neutral Format Painter Formatting Table v Clear ~ Filter ~ Select Data Clipboard Font Alignment Number Styles Cells Editing Sensitivity Add-ins AutoSave Off Save Undo ~ Redo ~ Data Bars . Data Labels v B11 C D E G Use this Excel spreadsheet to compute ratios; show your computations for all ratios on this tab, and also include your commentary. The 2014 financial statements used to calculate these ratios are available in the Investor Relations sections of the Nikeand Under Armour websites. Interpretation and comparison between the two com NIKE Under Armour (reading Chapter 13 will help you prepare the cor The comparison of the ratios is an important part of the project. A goc ratio tells us. Indicate whether a higher or lower ratio is better. Then Remember that each ratio below requires a comparison. 5/31/2014 12/31/2014 5 6 Earnings per Share of Common Stock (basic - common) As given in the income statement $ 3.05 $0.98 7 8 9 Current Ratio Current assets $13,696 2.72 $1,549,399 3.67 10 Current liabilities 65,027 $421,627 11 12 Gross Profit Rate Gross profit $12,446 44.8% $1,512,206 49.0% Net sales $27,799 $3,084,370 14 15 16 17 Profit Margin Net income $2,693 9.7% $208,042 6.7% 18 Net sales $27,799 $3,084,370 19 20 21 Inventory Turnover Cost of goods sold $15,353 4.1 $1,572, 164 3.1 $3,716 $502,860 22 Average inventory 25 Days in Inventory 365 days 365 88 365 117 26 Inventory turnover 4 1 days 3.1 days 28 Net credit sales 627,799 $3,084,370 126 29 Accounts Receivable Turnover 30 Average net accounts receivable $3.276 $244,894 31 32 Average Collection Period 365 days 365 43 365 29 33 Accounts receivable turnover 85 days 12.6 days 34 35 Asset turnover Net sales $27,799 1.54 $3,084,370 1.68 37 Average total assets $18,070 $1,836,412 28 Title Page Profiles Ratios Summary Bibliography +ACCT503_Sample_Project_Template (2) v Search X File Home Insert Page Layout Formulas Data Review View Automate Developer Help Power Pivot Comments Share & Cut Arial 12 ~ A" A ab Wrap Text General AutoSum Normal Bad AY O Paste [A Copy Fill BIUVA 383 Merge & Center $ % 9 00 20 Conditional Format as Good Neutral Insert Delete Format Sort & Find & Sensitivity Add-ins Analyze Format Painter Formatting Table v Clear Filter ~ Select Data Clipboard Font Alignment Number Styles Cells Editing Sensitivity Add-ins AutoSave Off Save Undo ~ Redo ~ Data Bars . Data Labels B11 vixfay A C F 29 Accounts Receivable Turnover Net credit sales $27,799 8. $3,084,370 12.6 30 Average net accounts receivable $3,276 $244,894 Average Collection Period 365 days 365 43 365 29 Accounts receivable turnover 8.5 days 126 days Asset turnover Net sales $27,799 1.54 $3,084,370 1.68 37 Average total assets $18,070 $1,836,412 40 Return on Assets (ROA) Net income $2,693 14.9% $208,042 11.3% Average total assets $18,070 $1,836,412 42 43 44 Debt to assets ratio Total Liabilities $7,770 41.8% $744,783 35.5% 45 Total Assets $18,594 $2,095,083 47 48 Times-Interest Earned Ratio Net income + interest expense + income tax expense 63,577 108.4 347,545 65 49 interest expense $33 i,335 52 Dividend Yield Dividend per share of common stock (Yahoo Finance 12/24/2015) $1.28 2.0% $0.00 0.0% (Please follow the Course Project instructions to calculate the current dividend yiel Market price per share of common stock (Yahoo Finance 12/24/2015) $63.18 $81.20 Return on Common Stockholders' Equity (ROE) Net income - preferred dividends 2.693 24.6% 208,042 17.3% 56 Average common stockholders' equity 10,952.50 1,201,827.00 Free cash flow $1,324 $78,505 60 Net cash provided by operating activities minus capital expenditures minus cash dividends n millions in thousands Price-Earnings Ratio Market price per share of common stock as of 5/30/2014 for Nike and 12/31/2014 for Under Armour $76.91 25 567.90 69 4 (Please see the Course Project instructions for the dates to use for this ratio.) Earnings per share $3.05 0.98 65 Title Page Profiles Ratios Summary BibliographyACCT503_Sample_Project_Template (2) v Search File Home Insert Page Layout Formulas Data Review View Automate Developer Help Power Pivot K Cut Arial 10 " A" A " ab Wrap Text General Normal Bad Paste LG Copy Merge & Center Conditional Format as Neu Format Painter Formatting Table * Good Clipboard Font Alignment Number Styles AutoSave (@ Off ) Save ) Undo * Redo * Data Bars * ; Data Labels A16 viXV fav B C F G H You all get the chance to play the role of financial analyst below. The summary should be a comparison of each company's performance for each major category of ratios listed below. Focus on major differences as you compare each company's performance. A nice way to conclude is to state which company you feel is the better investment and why. N . Liquidity: NIKE has the advantage for the current ratio. NIKE has $3.05 in current assets for every dollar in current liabilities while Under Armour has only 98 cents in current assets for every dollar in current liabilities. NIKE has the advantage for the inventory turnover ratio, but Under Armour has the advantage for the accounts receivable turnover ratio. NIKE turns over its inventory 4.1 times to Under Armour's 3.1 times. Under Armour has the advantage for the accounts receivable turnover ratio as Under Armour collects on its 3 receivables 12.6 times to Nike's 8.5 times. A Solvency: Under Armour has less debt than NIKE as evidenced by Under Armour's 35.5% debt-to-assets ratio as compared to NIKE's 41.8% debt-to-assets ratio. NIKE can cover its interest expense 108.4 times with income before interest and taxes, while Under Armour can only cover its interest expense 65.1 times with their income before interest and taxes. NIKE has free cash flow of $1.3 billion while Under Armour has 5 $78.5 million in free cash flow. Profitability: Under Armour has the advantage for the gross profit rate at 49% while NIKE has a 44.8% gross profit rate percentage. NIKE has the advantage for the profit margin ratio at 9.7% versus 6.7% for Under Armour. Under Armour has the advantage for asset turnover as they turn their assets 1.68 times to Nike's 1.54 times. NIKE has the advantage for both return on assets (ROA) and return on common stockholder's equity (ROE). NIKE has an ROA of 14.9% to Under Armour's 11.3%. NIKE also has the advantage for return on common stockholders' equity with an ROE of 24.6% to Under Armour's 17.3%. 8 Conclusion: Under Armour has less debt than NIKE as measured by the debt to assets ratio, but NIKE has a stronger current ratio and times-interest earned ratio. Regarding profitability, NIKE has the advantage for return on assets (ROA) and return on common stockholders' equity (ROE). For both a conservative investor 9 and growth investor, NIKE looks like the better choice. 10 12 13 14 15 16 17 18 19 20 Title Page P Profiles Ratios Summary Bibliography +X ACCT503_Sample_Project_Template (2) v Search File Home Insert Page Layout Formulas Data a Review View Automate Developer Help Power Pivot & Cu LO Arial 10 * A" A " = = 29 Wrap Text General Past B Copy BIU BOA- Merge & Center Format Painter Clipboard Font Alignment Number AutoSave ( Off ) Save ) Undo Redo * Data Bars * Data Labels A32 A B Your textbook and any information that you use to profile the companies should be cited as a reference below. MIA WN. Big Charts for Nike. (2014, May 30). Retrieved from http://bigcharts.marketwatch.com/historical/default.asp?symb=NKE&closeDate=5%2F30%2F14&x=0&y=0 Big Charts for Under Armour. (2014, December 31). Retrieved from http://bigcharts.marketwatch.com/historical/default.asp?symb=ua&closeDate=12%2F31%2F2014&x=37&y=26 Kimmel, P. D., Weygandt, J. J., & Kieso, D. E. (2019). Financial Accounting: Tools for Business Decision Making (9th ed.). Hoboken, NJ: John Wiley & Sons, Inc. 9 Nike's 2014 Annual Report. (2014). Retrieved from https://s1.q4cdn.com/806093406/files/doc_financials/2014/index.html 10 NKE profile. (2019). Retrieved from https:/finance.yahoo.com/quote/NKE/profile?p=NKE 11 NKE stock price. (December 24, 2015). Retrieved from https://finance.yahoo.com/quote/NKE/profile?p=NKE Under Armour 2014 Annual Report. (2015). Retrieved from https://underarmourinc.gcs-web.com/static-files/13a42846-a519-469e-978b- 12 b3199de9fbe8 13 UA profile. (2019). Retrieved from https://finance.yahoo.com/quote/UA/profile?p=UA&.tsrc=fin-srch 14 UA stock price. (December 24, 2015). Retrieved from https://finance.yahoo.com/quote/UA?Itr=1 15 16 17 18 19 20 21 22 23 38 Title Page Profiles Ratios Summary Bibliography +
Step by Step Solution
There are 3 Steps involved in it
1 Expert Approved Answer
Step: 1 Unlock
Question Has Been Solved by an Expert!
Get step-by-step solutions from verified subject matter experts
Step: 2 Unlock
Step: 3 Unlock
Students Have Also Explored These Related Accounting Questions!