

Question: X Y= WINDOW STAT PLOT F1 TBLSET F2 FORMAT F3 CALC F4 TABLE F5 resistance. The ammeter and voltmeter are ideal. ZOOM TRACE GRAPH voltmeter
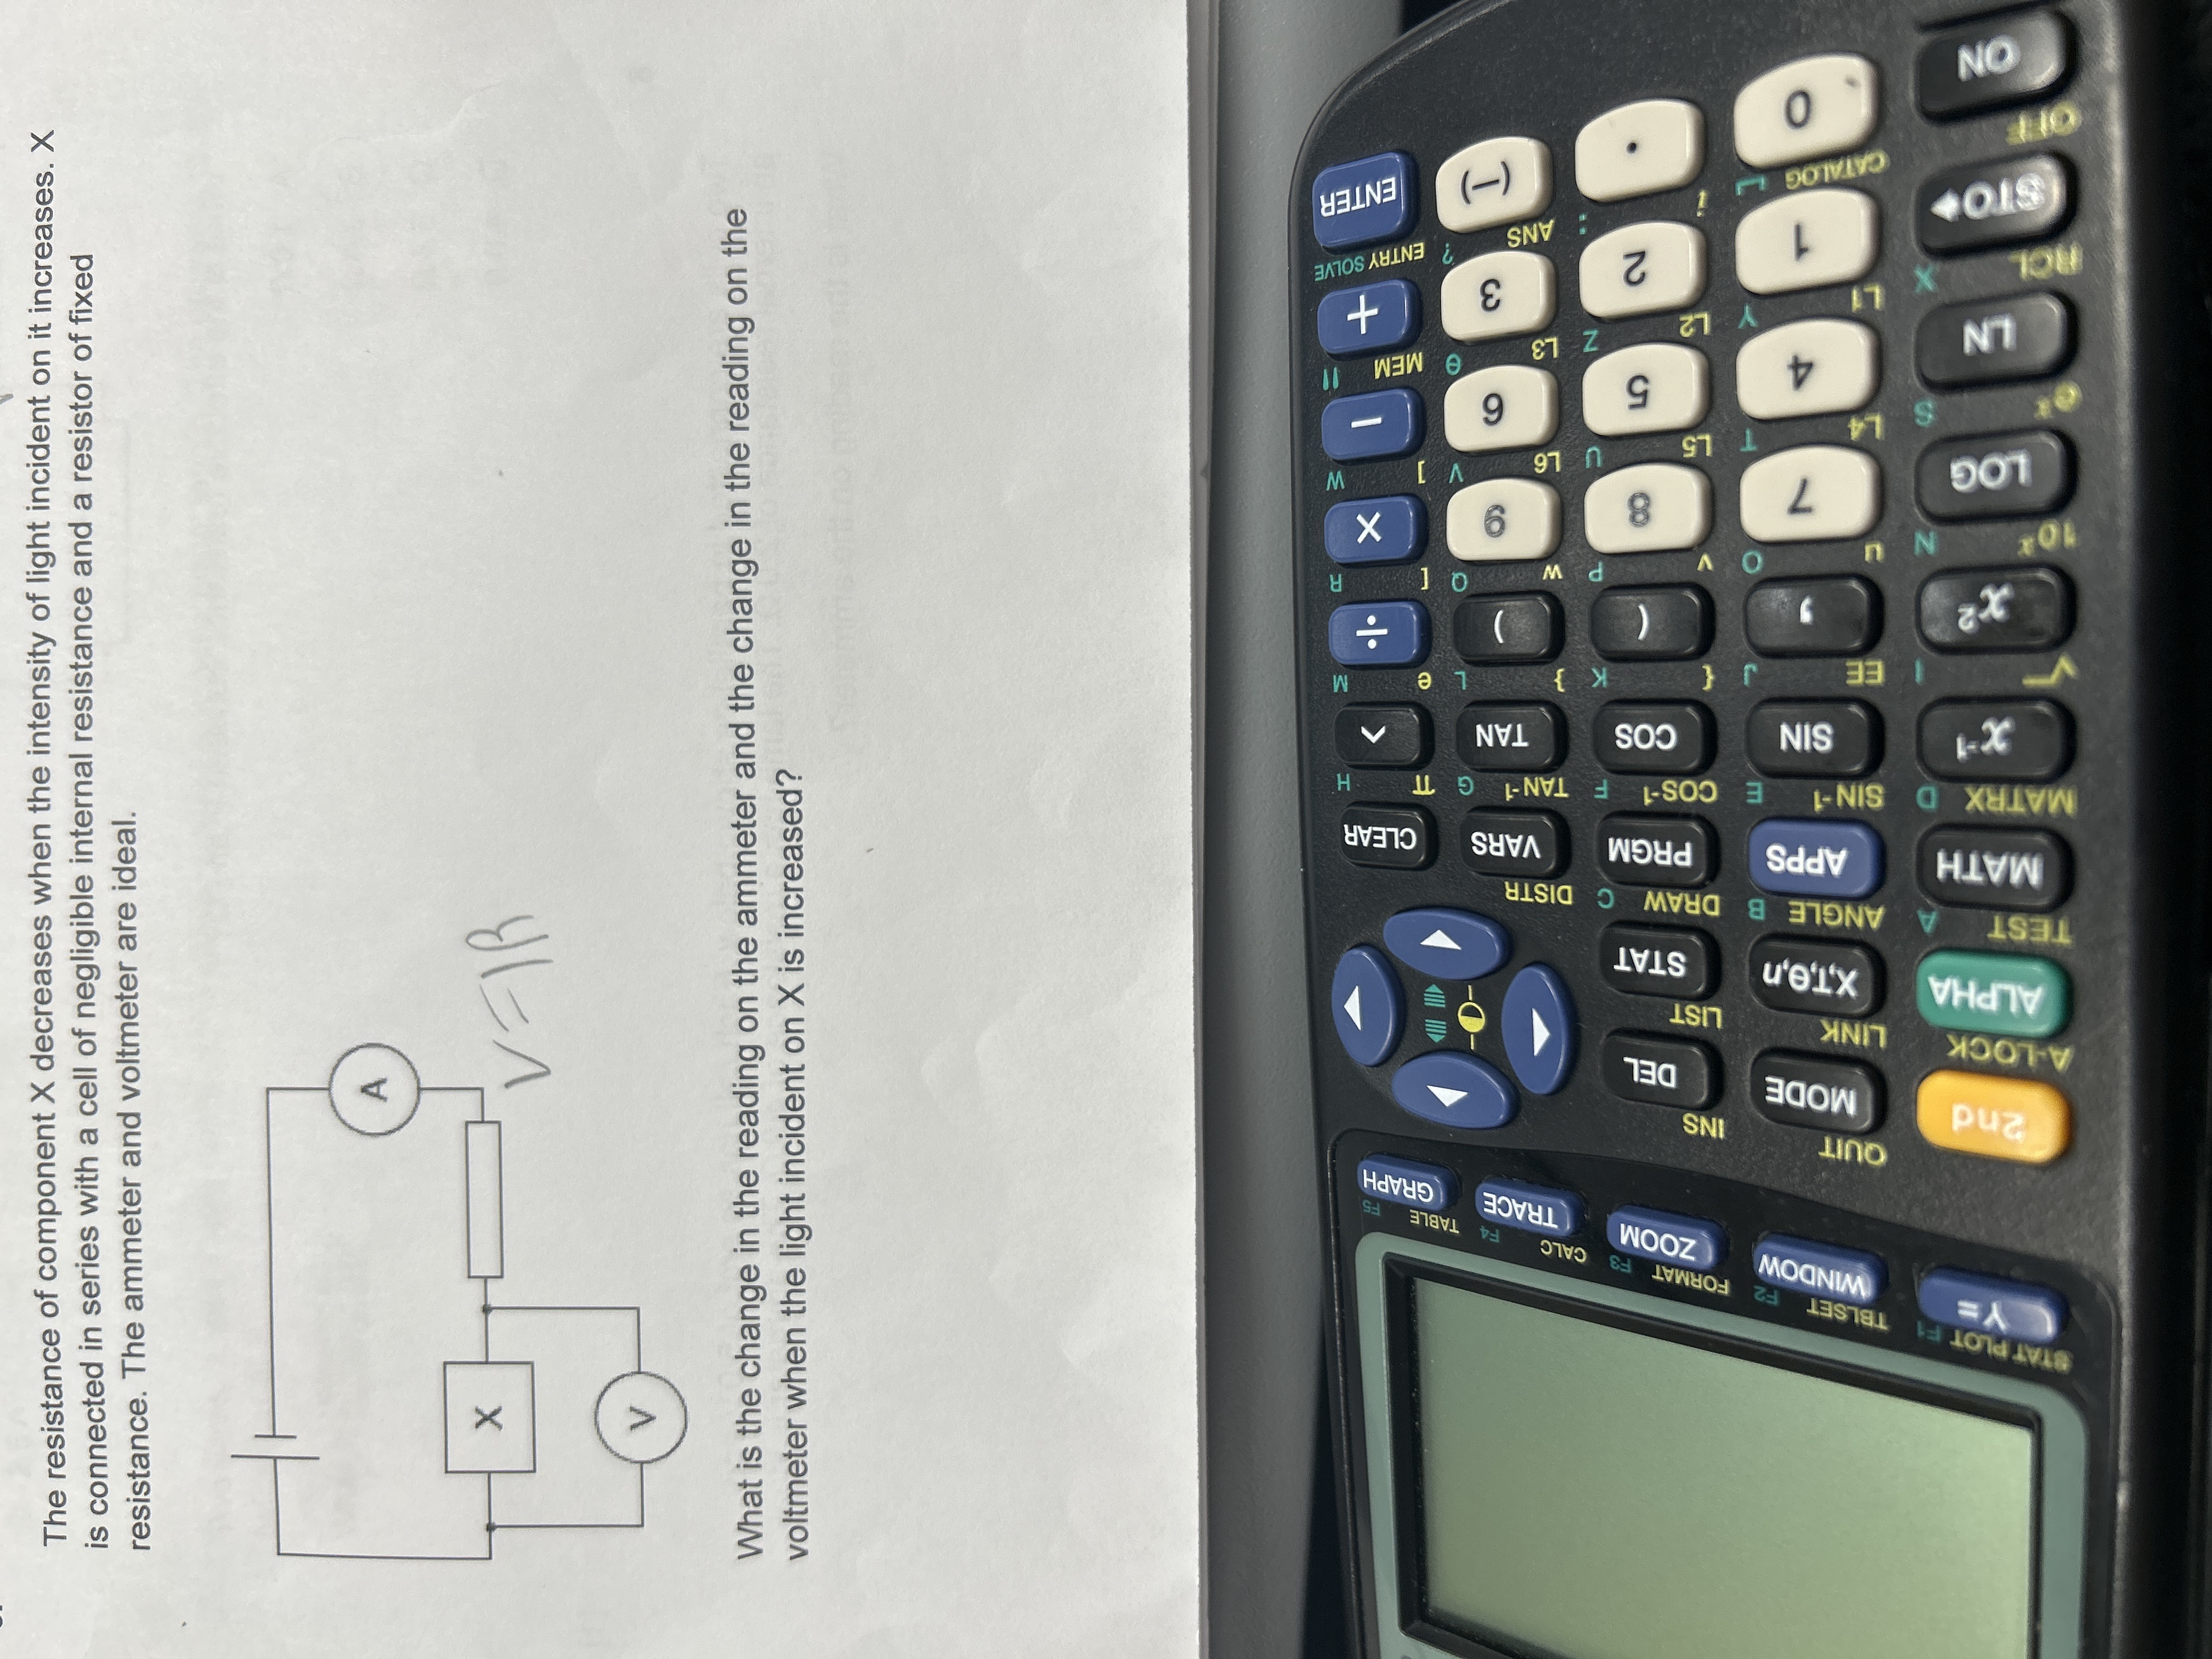
X Y= WINDOW STAT PLOT F1 TBLSET F2 FORMAT F3 CALC F4 TABLE F5 resistance. The ammeter and voltmeter are ideal. ZOOM TRACE GRAPH voltmeter when the light incident on X is increased? QUIT and INS MODE DEL A-LOCK LINK LIST ALPHA X,T,e,n is connected in series with a cell of negligible internal resistance and a resistor of fixed STAT What is the change in the reading on the ammeter and the change in the reading on the The resistance of component X decreases when the intensity of light incident on it increases. X TEST A ANGLE B DRAW C DISTR MATH APPS PRGM VARS CLEAR MATRX D SIN-1 LU COS-1 F TAN-1 TT SIN COS TAN EE W X CO U 16 L5 CO LO MEM CV ? ENTRY SOLVE ANS ENTER
Step by Step Solution
There are 3 Steps involved in it

Get step-by-step solutions from verified subject matter experts