

Question: xbar Chart for board.thickness UCL CL LCL 1 3 5 7 9 11 14 17 20 23 Group Number of groups = 25 Center
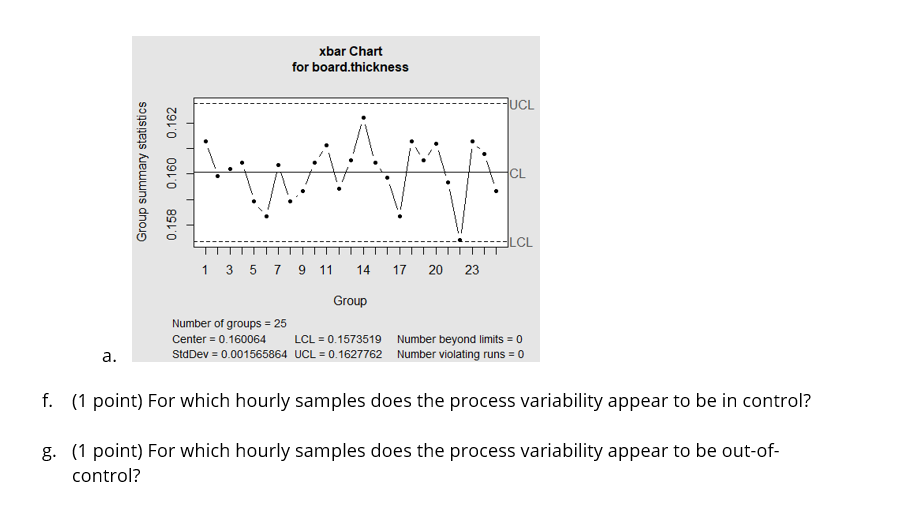
xbar Chart for board.thickness UCL CL LCL 1 3 5 7 9 11 14 17 20 23 Group Number of groups = 25 Center =0.160064 LCL = 0.1573519 Number beyond limits = 0 a. StdDev = 0.001565864 UCL = 0.1627762 Number violating runs = 0 f. (1 point) For which hourly samples does the process variability appear to be in control? g. (1 point) For which hourly samples does the process variability appear to be out-of- control?
Step by Step Solution
There are 3 Steps involved in it
1 Expert Approved Answer
Step: 1 Unlock

Question Has Been Solved by an Expert!
Get step-by-step solutions from verified subject matter experts
Step: 2 Unlock
Step: 3 Unlock