Question: X-Chart and R-Chart Example Madan Lal & Sons is a fictional Indian manufacturer of high-quality cricket balls. The balls are 100% handmade and consist of
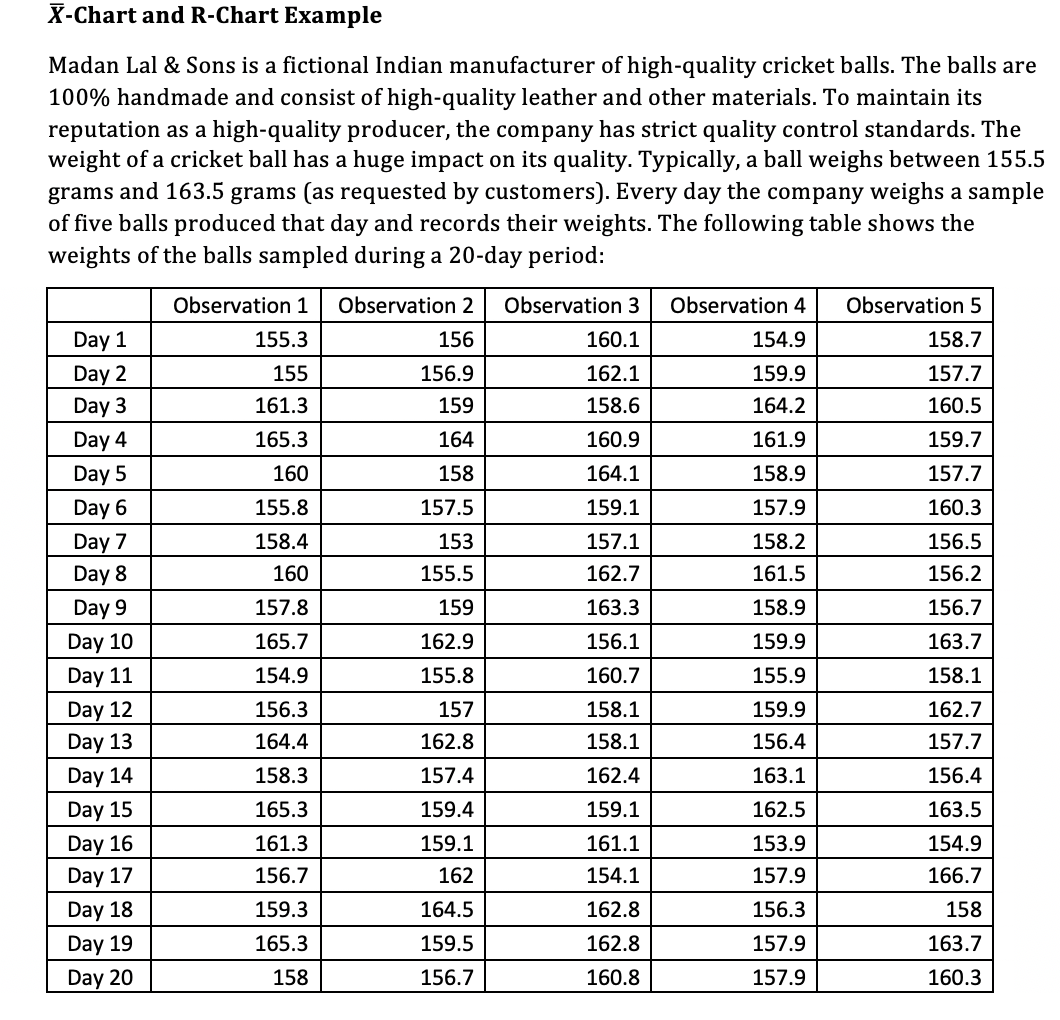
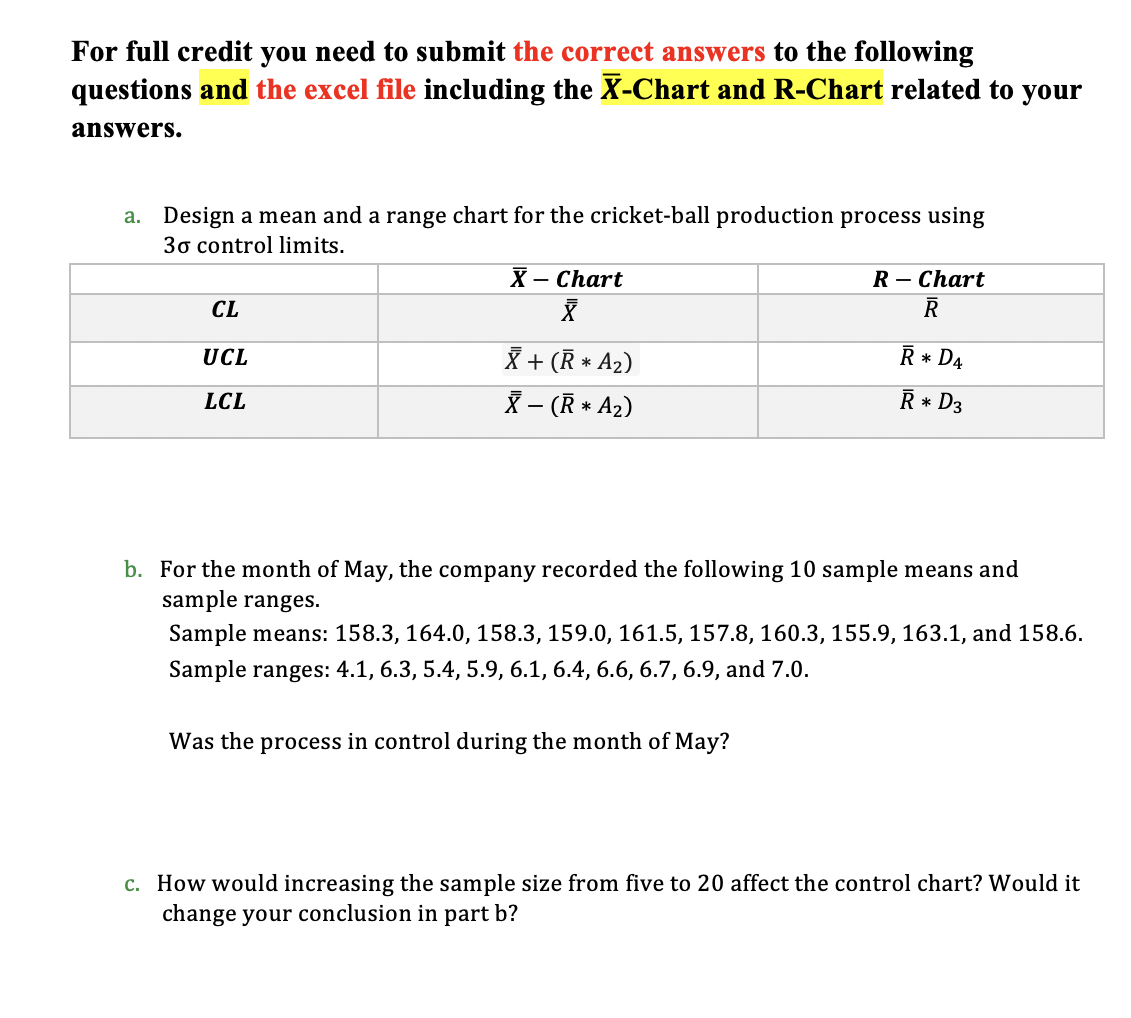
X-Chart and R-Chart Example Madan Lal & Sons is a fictional Indian manufacturer of high-quality cricket balls. The balls are 100% handmade and consist of high-quality leather and other materials. To maintain its reputation as a high-quality producer, the company has strict quality control standards. The weight of a cricket ball has a huge impact on its quality. Typically, a ball weighs between 155.5 grams and 163.5 grams (as requested by customers). Every day the company weighs a sample of five balls produced that day and records their weights. The following table shows the weights of the balls sampled during a 20-day period: Observation 2 Observation 4 Observation 5 Observation 1 155.3 Observation 3 160.1 156 158.7 155 156.9 159 162.1 158.6 154.9 159.9 164.2 157.7 160.5 161.3 165.3 164 160.9 159.7 161.9 158.9 160 158 164.1 157.7 155.8 157.9 160.3 158.4 160 157.5 153 155.5 159.1 157.1 162.7 158.2 161.5 156.5 156.2 159 163.3 158.9 156.7 157.8 165.7 162.9 156.1 159.9 163.7 Day 1 Day 2 Day 3 Day 4 Day 5 Day 6 Day 7 Day 8 Day 9 Day 10 Day 11 Day 12 Day 13 Day 14 Day 15 Day 16 Day 17 Day 18 Day 19 Day 20 154.9 155.8 160.7 158.1 156.3 164.4 157 162.8 158.1 158.1 155.9 159.9 156.4 162.7 157.7 158.3 157.4 162.4 163.1 156.4 165.3 159.4 159.1 162.5 163.5 159.1 153.9 161.3 156.7 161.1 154.1 154.9 166.7 162 157.9 156.3 159.3 164.5 162.8 158 165.3 159.5 163.7 162.8 160.8 157.9 157.9 158 156.7 160.3 For full credit you need to submit the correct answers to the following questions and the excel file including the X-Chart and R-Chart related to your answers. a. Design a mean and a range chart for the cricket-ball production process using 3o control limits. X - Chart R- Chart CL R UCL * D4 X + ( * A2) X ( * A2) LCL R * D3 b. For the month of May, the company recorded the following 10 sample means and sample ranges. Sample means: 158.3, 164.0, 158.3, 159.0, 161.5, 157.8, 160.3, 155.9, 163.1, and 158.6. Sample ranges: 4.1,6.3, 5.4,5.9, 6.1,6.4, 6.6, 6.7, 6.9, and 7.0. Was the process in control during the month of May? c. How would increasing the sample size from five to 20 affect the control chart? Would it change your conclusion in part b


