

Question: XDA Using the SML - Excel ? FILE HOME INSERT PAGE LAYOUT FORMULAS DATA REVIEW VIEW Sign In * Arial 12 I % Paste BIU-
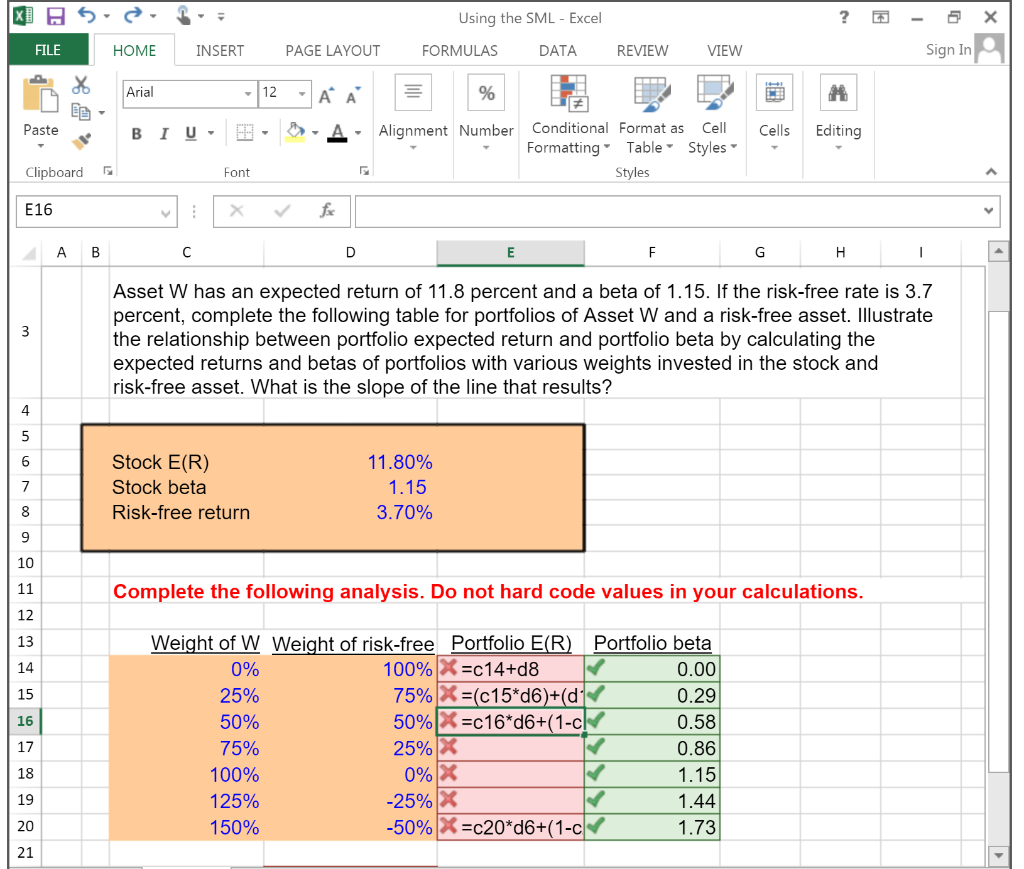
XDA Using the SML - Excel ? FILE HOME INSERT PAGE LAYOUT FORMULAS DATA REVIEW VIEW Sign In * Arial 12 I % Paste BIU- A- Alignment Number Cells Editing Conditional Format as Formatting Table Styles Styles Clipboard Font E16 A B C D F G H 1 3 Asset W has an expected return of 11.8 percent and a beta of 1.15. If the risk-free rate is 3.7 percent, complete the following table for portfolios of Asset W and a risk-free asset. Illustrate the relationship between portfolio expected return and portfolio beta by calculating the expected returns and betas of portfolios with various weights invested in the stock and risk-free asset. What is the slope of the line that results? 4 5 6 7 Stock E(R) Stock beta Risk-free return 11.80% 1.15 3.70% 8 9 10 11 Complete the following analysis. Do not hard code values in your calculations. 12 13 14 15 16 Weight of W Weight of risk-free Portfolio E(R) Portfolio beta 0% 100% X=c14+d8 0.00 25% 75% X=(c15*d6)+(dis 0.29 50% 50% X=c16*d6+(1-cl 0.58 75% 25% X 0.86 100% 1.15 125% 1.44 150% -50% X =c20*d6+(1-C 1.73 17 18 0% X -25% X 19 20 21 Slope of SML
Step by Step Solution
There are 3 Steps involved in it

Get step-by-step solutions from verified subject matter experts