

Question: -Xh 8 C D E G H 3 K L M You have been given the expected return data shown in the first table on
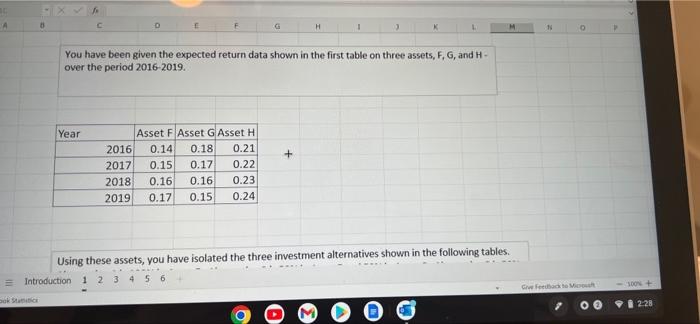
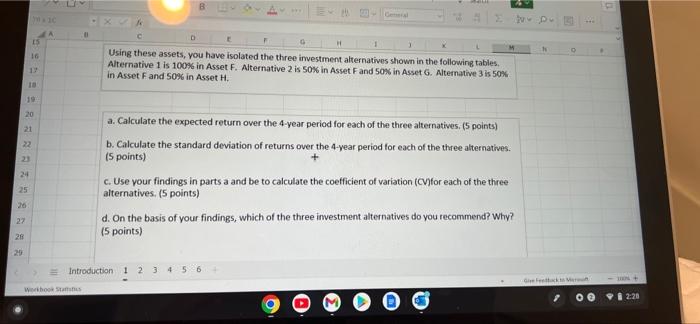
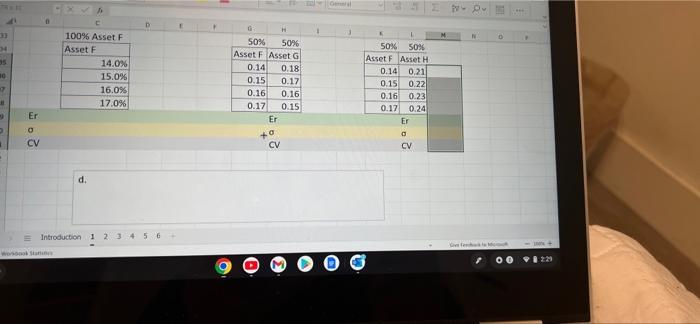
-Xh 8 C D E G H 3 K L M You have been given the expected return data shown in the first table on three assets, F, G, and H- over the period 2016-2019. Year Asset F Asset G Asset H + 2016 0.14 0.18 0.21 2017 0.15 0.17 0.22 2018 0.16 0.16 0.23 2019 0.17 0.15 0.24 Using these assets, you have isolated the three investment alternatives shown in the following tables. Introduction 1 2 3 4 5 6 ook Static 15 A 11 O Give Feedback to Micro 00 100% + 2:28 22 21 23 24 25 26 CEASARANAZANAR 27 28 10 19 29 15 16 A B 2 0 D E G H 1 Using these assets, you have isolated the three investment alternatives shown in the following tables. Alternative 1 is 100% in Asset F. Alternative 2 is 50% in Asset F and 50% in Asset G. Alternative 3 is 50% in Asset F and 50% in Asset H. a. Calculate the expected return over the 4-year period for each of the three alternatives. (5 points) b. Calculate the standard deviation of returns over the 4-year period for each of the three alternatives. (5 points) c. Use your findings in parts a and be to calculate the coefficient of variation (CV)for each of the three alternatives. (5 points) d. On the basis of your findings, which of the three investment alternatives do you recommend? Why? (5 points) Introduction 1 2 3 4 5 6 Workbook Status 2 Du O Give Feedback M 00 2:20 33 34 95 NO 17 B 2 D Er O CV D 100% Asset F Asset F Wosonok Stain 14.0% 15.0% 16.0% 17.0% d. Introduction 1 2 3456+ F G H 50% 50% Asset F Asset G 0.14 0.18 0.15 0.17 0.16 0.16 0.17 0.15 Er +0 CV 1 3 K L 50% 50% Asset F Asset H 0.14 0.21 0.15 0.22 0.16 0.23 0.17 0.24 Er 0 CV 2 DE N Tento M 7 *** P 00 1229
Step by Step Solution
There are 3 Steps involved in it

Get step-by-step solutions from verified subject matter experts