

Question: x(t) and y(t) functions are defined as follows: x(t) = t-t? + sin(e-) In(VT) x 2 y(t) (t-2)(t - 3) t4 + 1/t Write a
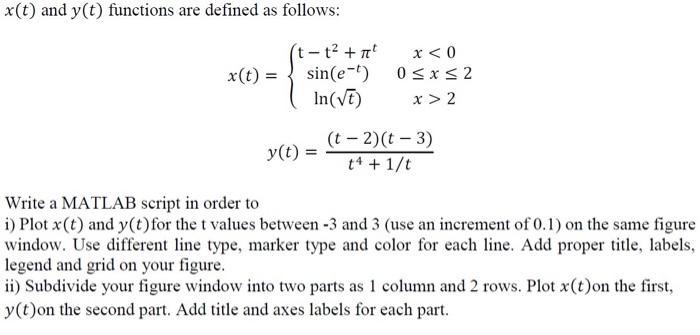
x(t) and y(t) functions are defined as follows: x(t) = t-t? + sin(e-) In(VT) x 2 y(t) (t-2)(t - 3) t4 + 1/t Write a MATLAB script in order to i) Plot x(t) and y(t) for the t values between -3 and 3 (use an increment of 0.1) on the same figure window. Use different line type, marker type and color for each line. Add proper title, labels, legend and grid on your figure. ii) Subdivide your figure window into two parts as 1 column and 2 rows. Plot x(t)on the first, y(t)on the second part. Add title and axes labels for each part
Step by Step Solution
There are 3 Steps involved in it
1 Expert Approved Answer
Step: 1 Unlock

Question Has Been Solved by an Expert!
Get step-by-step solutions from verified subject matter experts
Step: 2 Unlock
Step: 3 Unlock