

Question: x(x)= Graph the associated points and regression line. (b) What does the slope tell you about the relationship between the number of social science doctorates
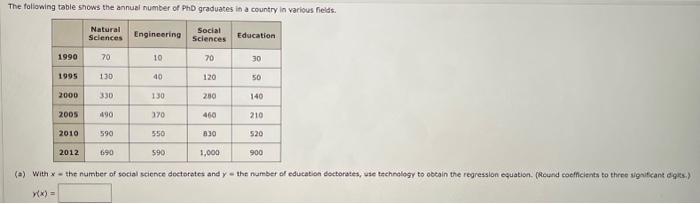
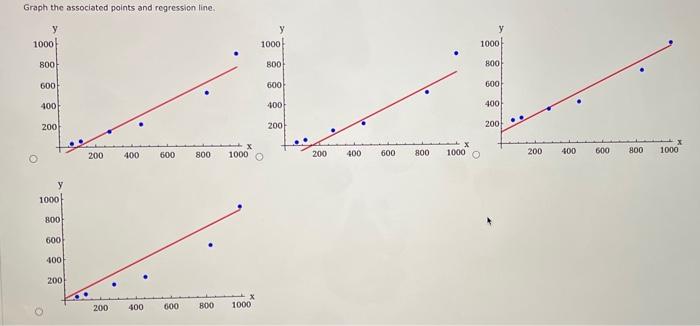
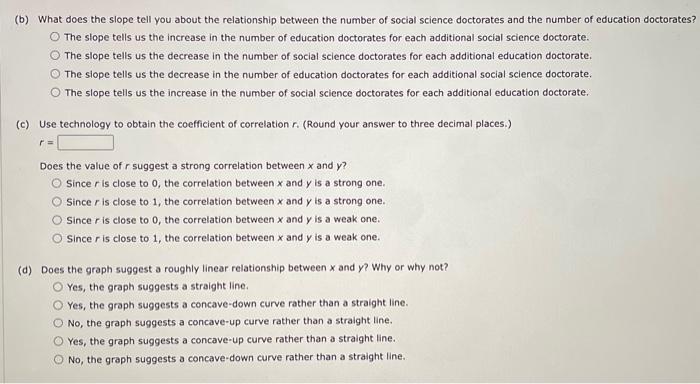
x(x)= Graph the associated points and regression line. (b) What does the slope tell you about the relationship between the number of social science doctorates and the number of education doctorates? The slope tells us the increase in the number of education doctorates for each additional social science doctorate. The slope tells us the decrease in the number of social science doctorates for each additional education doctorate. The siope tells us the decrease in the number of education doctorates for each additional social science doctorate. The slope tells us the increase in the number of social science doctorates for each additional education doctorate. (c) Use technology to obtain the coefficient of correlation r. (Round your answer to three decimal places.) r= Does the value of r suggest a strong correlation between x and y ? Since r is close to 0 , the correlation between x and y is a strong one. Since r is close to 1 , the correlation between x and y is a strong one. Since r is close to 0 , the correlation between x and y is a weak one. Since r is close to 1 , the correlation between x and y is a weak one. (d) Does the graph suggest a roughly linear relationship between x and y ? Why or why not? Yes, the graph suggests a straight line. Yes, the graph suggests a concave-down curve rather than a straight line. No, the graph suggests a concave-up curve rather than a straight line. Yes, the graph suggests a concave-up curve rather than a straight line. No, the graph suggests a concave-down curve rather than a straight line
Step by Step Solution
There are 3 Steps involved in it

Get step-by-step solutions from verified subject matter experts