

Question: XYZ stock price and dividend history are as follows: Beginning-of-Year Price $140 159 132 Dividend Paid at Year-End $ 4 Year 2015 2016 2017 2018
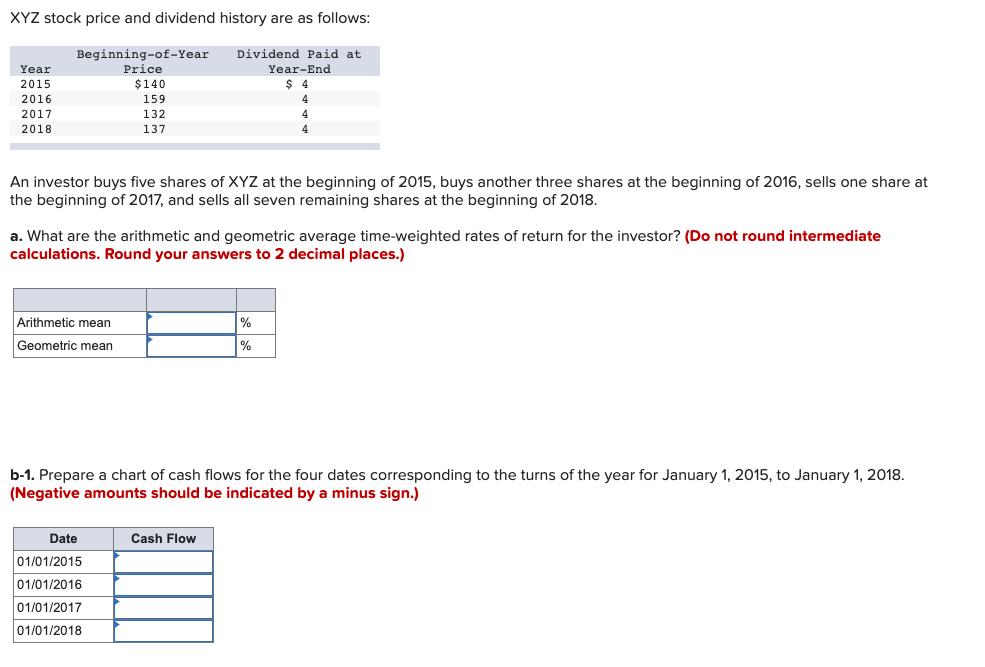
XYZ stock price and dividend history are as follows: Beginning-of-Year Price $140 159 132 Dividend Paid at Year-End $ 4 Year 2015 2016 2017 2018 137 An investor buys five shares of XYZ at the beginning of 2015, buys another three shares at the beginning of 2016, sells one share at the beginning of 2017, and sells all seven remaining shares at the beginning of 2018. a. What are the arithmetic and geometric average time-weighted rates of return for the investor? (Do not round intermediate calculations. Round your answers to 2 decimal places.) Arithmetic mean Geometric mean b-1. Prepare a chart of cash flows for the four dates corresponding to the turns of the year for January 1, 2015, to January 1, 2018. (Negative amounts should be indicated by a minus sign.) Cash Flow Date 01/01/2015 01/01/2016 01/01/2017 01/01/2018
Step by Step Solution
There are 3 Steps involved in it

Get step-by-step solutions from verified subject matter experts