

Question: Y = [ 55 71; ... 42 67; ... 40 60; ... 38 57 ]; E = [ 5 6; ... 8 7; ... 9
Y = [ 55 71; ... 42 67; ... 40 60; ... 38 57 ]; E = [ 5 6; ... 8 7; ... 9 9; ... 10 10 ];
The matrix Y contains outcomes from a learning experiment. The first and second column contain performance observations for four age groups before and after training respectively. The matrix E contains error measurements (i.e., standard error of the mean) that correspond to the values in Y.
Reproduce the figure below using Matlab code and the matrices Y and E. Note that the blue and red bars correspond to the Y values and the length of errorbars correspond to the E values.
Requirements:
1) Your code should reproduce all aspects of the illustration below
2) Your Matlab figure should have error bars that extend upward only
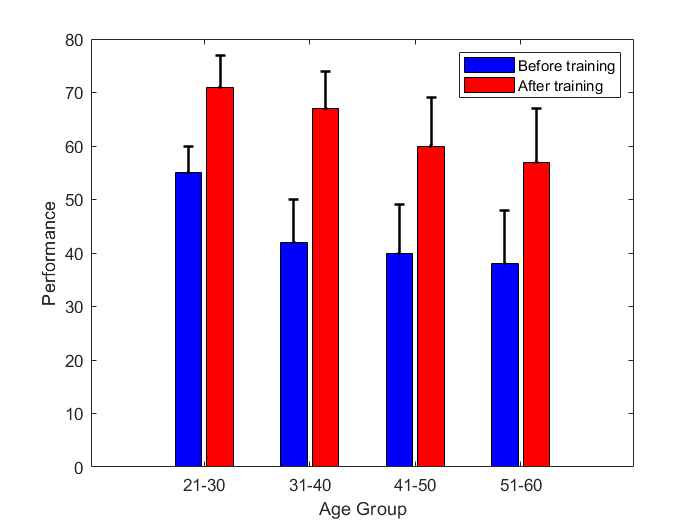
80 Before training After training 70 60 50 Performance 40 30 20 10 0 21-30 51-60 31-40 41-50 Age Group 80 Before training After training 70 60 50 Performance 40 30 20 10 0 21-30 51-60 31-40 41-50 Age Group
Step by Step Solution
There are 3 Steps involved in it

Get step-by-step solutions from verified subject matter experts