

Question: Y6 Question #1: Use the data in Table 1 below to answer the questions that follow. Table 1: Demand and Supply Schedules for Plastic Q
Y6
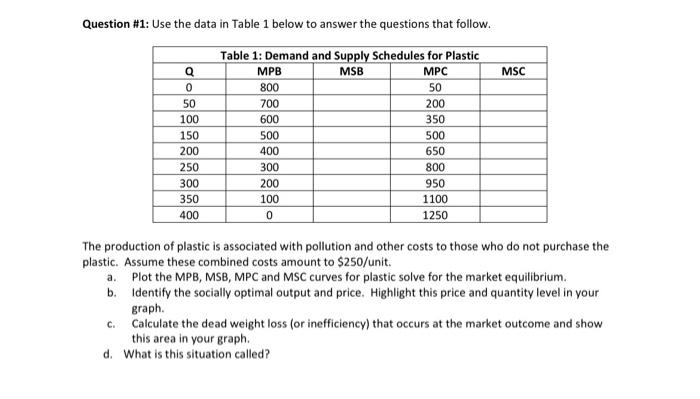
Question #1: Use the data in Table 1 below to answer the questions that follow. Table 1: Demand and Supply Schedules for Plastic Q MPB MSB MPC MSC 800 50 50 700 200 100 600 350 150 500 500 200 400 650 250 300 800 300 200 950 350 100 1100 400 0 1250 The production of plastic is associated with pollution and other costs to those who do not purchase the plastic. Assume these combined costs amount to $250/unit. a. Plot the MPB, MSB, MPC and MSC curves for plastic solve for the market equilibrium. b. Identify the socially optimal output and price. Highlight this price and quantity level in your graph. c. Calculate the dead weight loss (or inefficiency) that occurs at the market outcome and show this area in your graph. d. What is this situation called
Step by Step Solution
There are 3 Steps involved in it

Get step-by-step solutions from verified subject matter experts