

Question: Yea 3 r 200 3 2. Based on the information provided above, An Analyst compiled the following information of that firm, which is currently rated
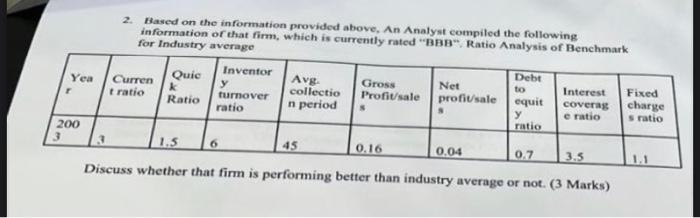
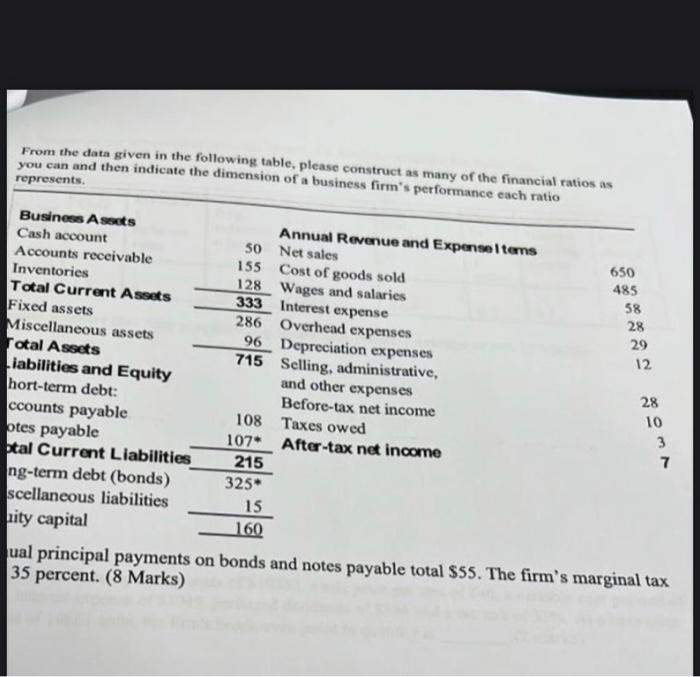
Yea 3 r 200 3 2. Based on the information provided above, An Analyst compiled the following information of that firm, which is currently rated "BBB". Ratio Analysis of Benchmark for Industry average Curren t ratio Quic k Ratio Inventor y turnover ratio Avg. collectio n period 6 Gross Profit/sale 45 Net profit/sale 0.16 S 1.5 Discuss whether that firm is performing better than industry average or not. (3 Marks) Debt to 0.04 equit y ratio Interest coverag e ratio 0.7 3.5 Fixed charge s ratio From the data given in the following table, please construct as many of the financial ratios as you can and then indicate the dimension of a business firm's performance each ratio represents. Business Assots Cash account Accounts receivable Inventories Total Current Assets Fixed assets Miscellaneous assets Total Assets Liabilities and Equity hort-term debt: ccounts payable otes payable otal Current Liabilities ng-term debt (bonds) scellaneous liabilities ity capital 50 155 128 333 286 96 715 108 107* 215 325* 15 160 Annual Revenue and Expense Items Net sales Cost of goods sold Wages and salaries Interest expense Overhead expenses Depreciation expenses Selling, administrative, and other expenses Before-tax net income Taxes owed After-tax net income 650 485 58 28 29 12 28 10 3 7 ual principal payments on bonds and notes payable total $55. The firm's marginal tax 35 percent. (8 Marks)
Step by Step Solution
There are 3 Steps involved in it

Get step-by-step solutions from verified subject matter experts