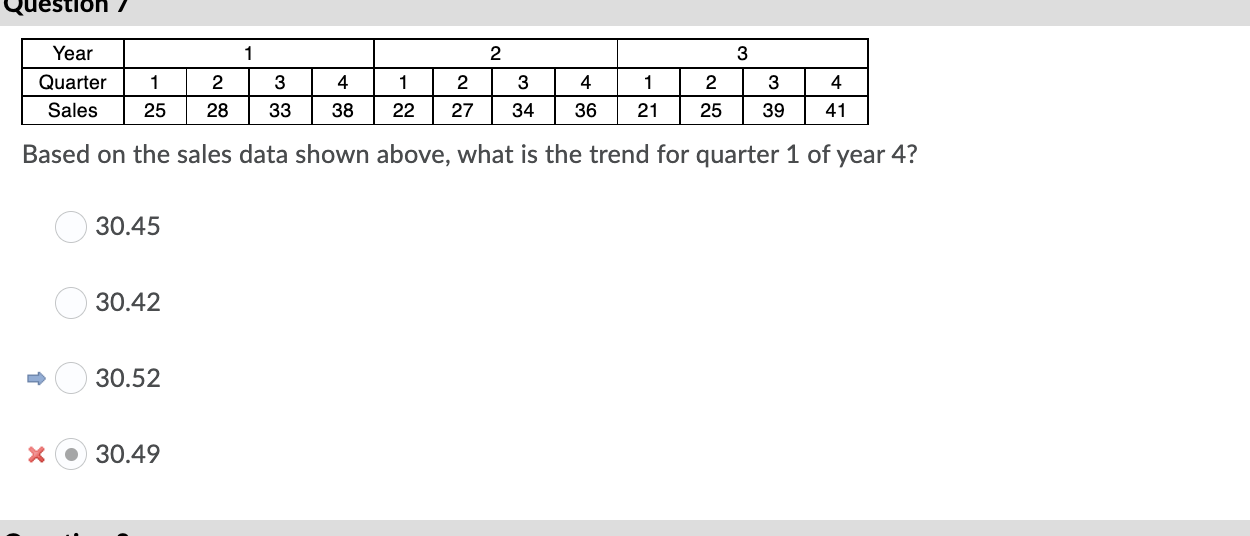
Question: Year 1 2 3 1 2 3 4 1 4 2 3 Quarter Sales 2 27 3 34 1 21 4 41 25 28 33

Year 1 2 3 1 2 3 4 1 4 2 3 Quarter Sales 2 27 3

Year 1 2 3 1 2 3 4 1 4 2 3 Quarter Sales 2 27 3 34 1 21 4 41 25 28 33 38 22 36 25 39 Based on the sales data shown above, what is the trend for quarter 1 of year 4? 30.45 30.42 30.52 x 30.49

Step by Step Solution

There are 3 Steps involved in it

1 Expert Approved Answer
Step: 1 Unlock blur-text-image
Question Has Been Solved by an Expert!

Get step-by-step solutions from verified subject matter experts

Step: 2 Unlock
Step: 3 Unlock

Students Have Also Explored These Related General Management Questions!