

Question: year 2. This graph shows interest earned by an annuity that pays $17 000 at the end of each for time periods of up to
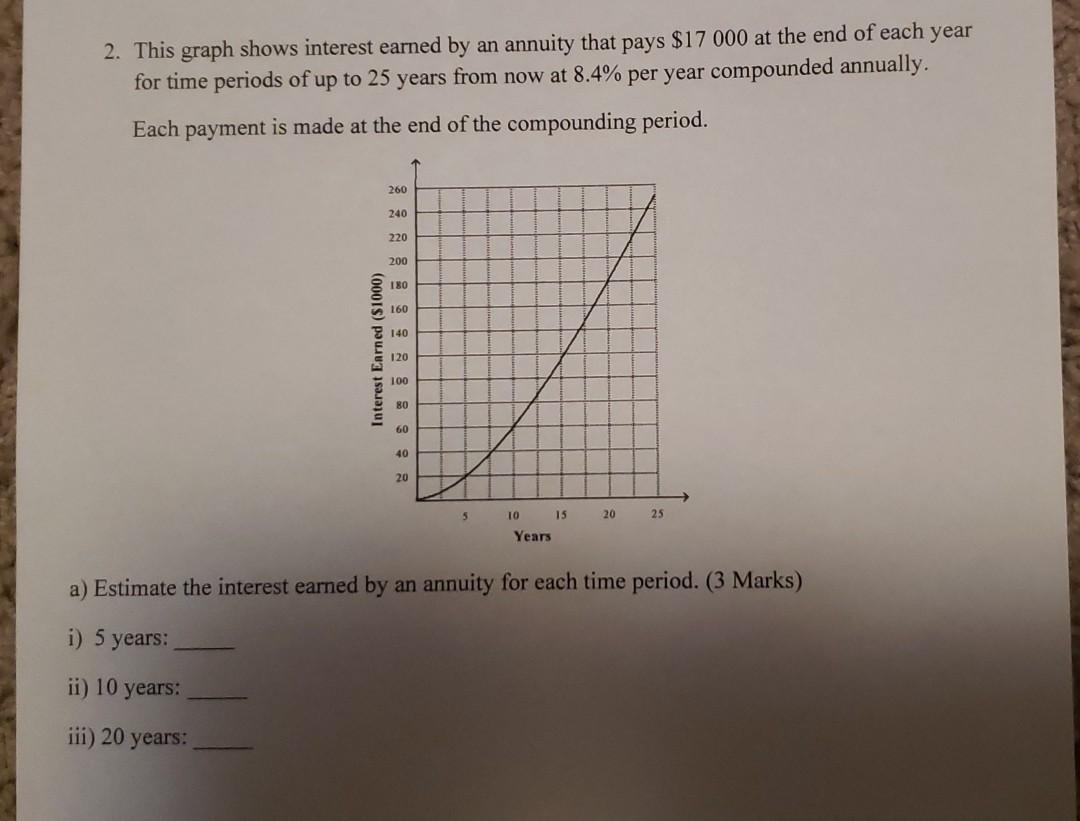
year 2. This graph shows interest earned by an annuity that pays $17 000 at the end of each for time periods of up to 25 years from now at 8.4% per year compounded annually. Each payment is made at the end of the compounding period. 260 240 220 200 180 160 140 Interest Earned (91000) 120 100 80 60 40 20 5 10 15 20 25 Years a) Estimate the interest earned by an annuity for each time period. (3 Marks) i) 5 years: ii) 10 years: iii) 20 years
Step by Step Solution
There are 3 Steps involved in it
1 Expert Approved Answer
Step: 1 Unlock

Question Has Been Solved by an Expert!
Get step-by-step solutions from verified subject matter experts
Step: 2 Unlock
Step: 3 Unlock