

Question: Year HD Returns LOW Returns 2 0 0 5 - 4 . 3 % 1 6 . 1 % 2 0 0 6 1 .
Year HD Returns LOW Returns
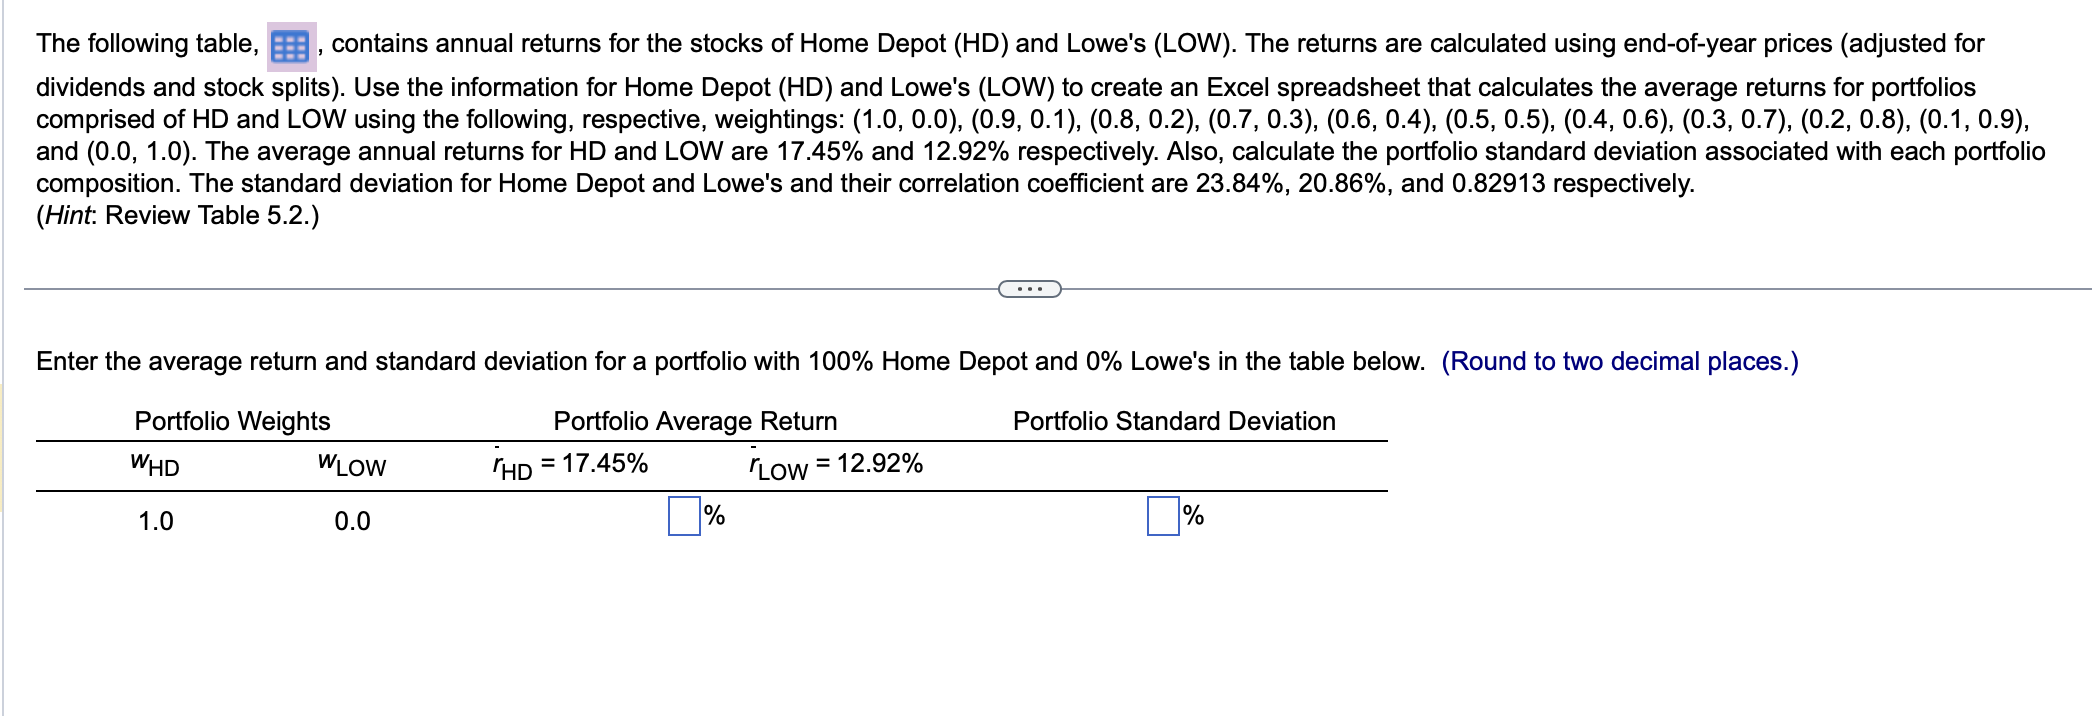
The following table, contains annual returns for the stocks of Home Depot HD and Lowe's LOW The returns are calculated using endofyear prices adjusted for
dividends and stock splits Use the information for Home Depot HD and Lowe's LOW to create an Excel spreadsheet that calculates the average returns for portfolios
comprised of HD and LOW using the following, respective, weightings:
and The average annual returns for HD and LOW are and respectively. Also, calculate the portfolio standard deviation associated with each portfolio
composition. The standard deviation for Home Depot and Lowe's and their correlation coefficient are and respectively.
Hint: Review Table
Enter the average return and standard deviation for a portfolio with Home Depot and Lowe's in the table below. Round to two decimal places.
Step by Step Solution
There are 3 Steps involved in it
1 Expert Approved Answer
Step: 1 Unlock

Question Has Been Solved by an Expert!
Get step-by-step solutions from verified subject matter experts
Step: 2 Unlock
Step: 3 Unlock