

Year S&P 500 3-month Tbill 10-year Thond Baa Bond Real Estate 1928 43.81% 3.08% 0.84% 3.22%...
Fantastic news! We've Found the answer you've been seeking!
Question:
Transcribed Image Text:
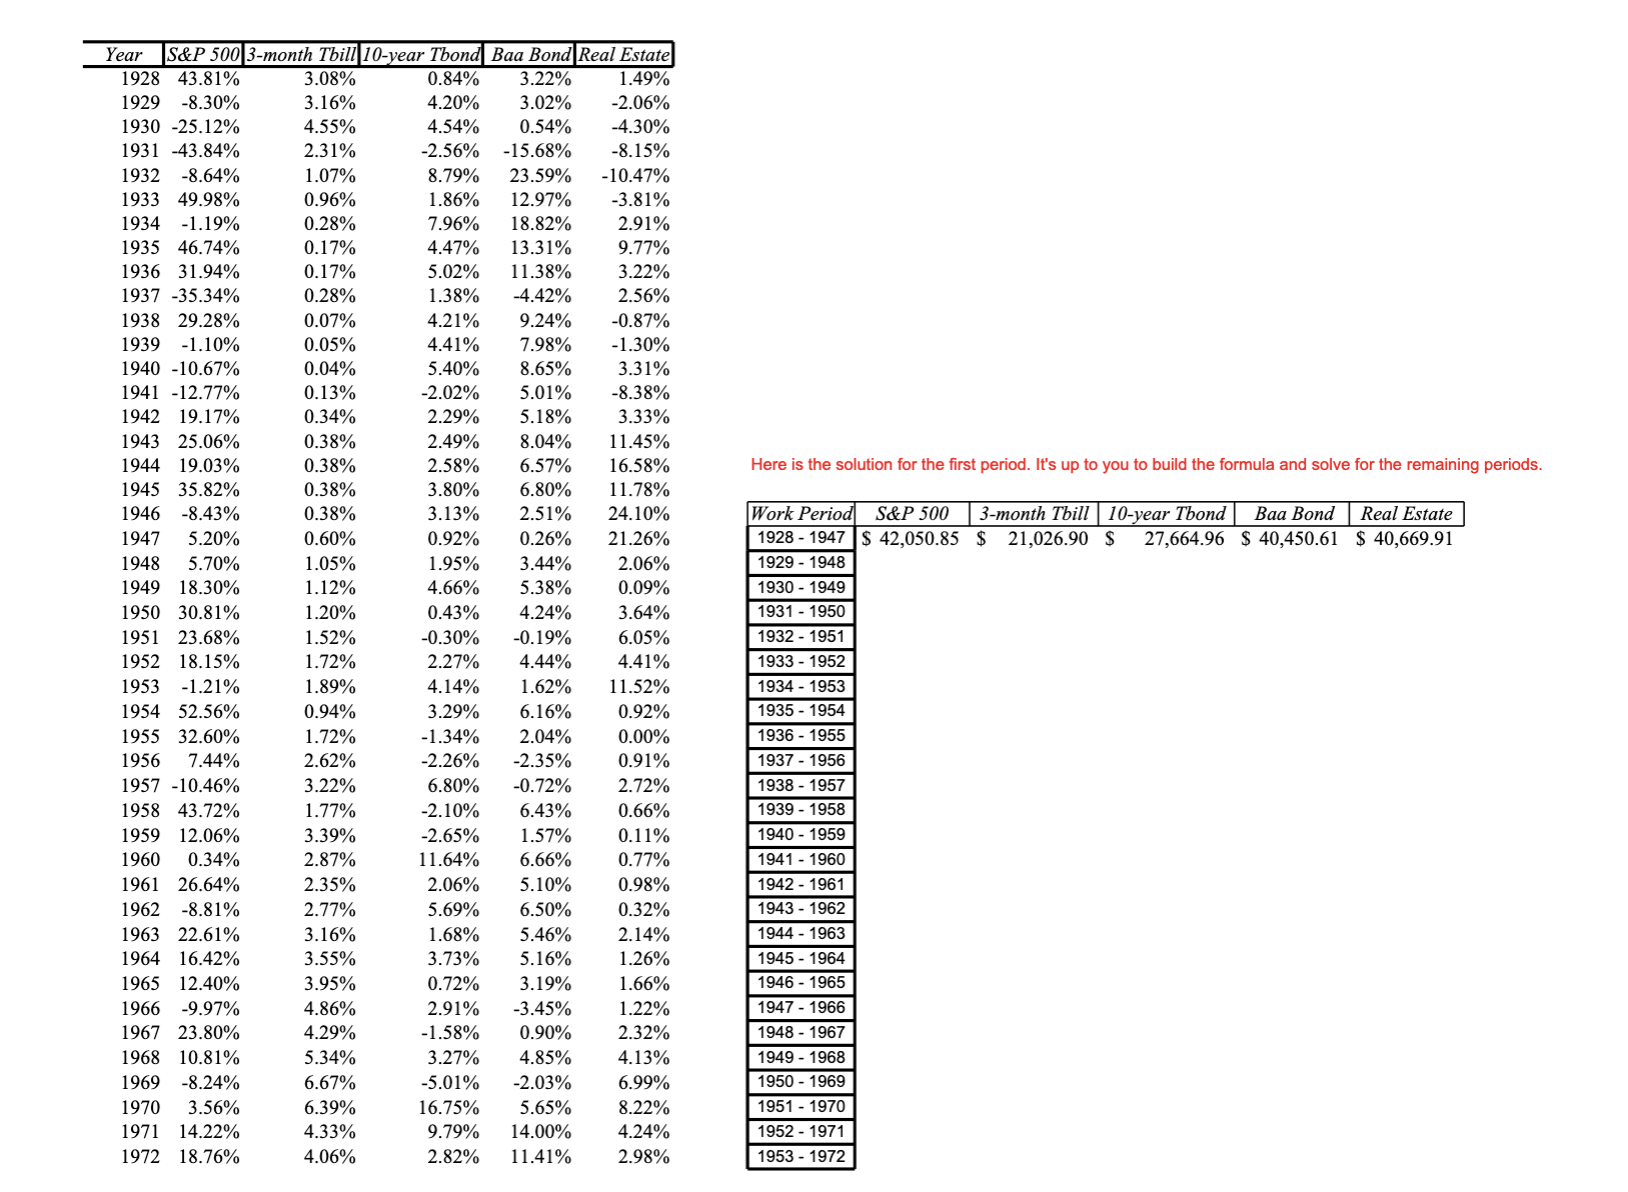
Year S&P 500 3-month Tbill 10-year Thond Baa Bond Real Estate 1928 43.81% 3.08% 0.84% 3.22% 1929 -8.30% 3.16% 3.02% 1930 -25.12% 4.55% 4.20% 4.54% 0.54% -4.30% 1.49% -2.06% 1931 -43.84% 2.31% -2.56% -15.68% -8.15% 1932 -8.64% 1.07% 8.79% 23.59% 1933 49.98% 0.96% -10.47% 1.86% 12.97% -3.81% 1934 -1.19% 0.28% 7.96% 18.82% 2.91% 1935 46.74% 0.17% 4.47% 13.31% 9.77% 1936 31.94% 0.17% 5.02% 11.38% 3.22% 1937 -35.34% 0.28% 1.38% -4.42% 2.56% 1938 29.28% 0.07% 4.21% 9.24% -0.87% 1939 -1.10% 0.05% 4.41% 7.98% -1.30% 1940 -10.67% 0.04% 5.40% 8.65% 3.31% 1941 -12.77% 0.13% -2.02% 5.01% -8.38% 1942 19.17% 0.34% 2.29% 5.18% 3.33% 1943 25.06% 0.38% 2.49% 8.04% 1944 19.03% 0.38% 1945 35.82% 0.38% 3.80% 2.58% 6.57% 6.80% 1946 -8.43% 0.38% 3.13% 2.51% 11.45% 16.58% 11.78% 24.10% Here is the solution for the first period. It's up to you to build the formula and solve for the remaining periods. 1947 5.20% 0.60% 0.92% 0.26% 21.26% Work Period S&P 500 3-month Tbill 10-year Tbond 1928 1947 $ 42,050.85 $ 21,026.90 $ 27,664.96 Baa Bond Real Estate $ 40,450.61 $ 40,669.91 1948 5.70% 1.05% 1.95% 3.44% 2.06% 1929-1948 1949 18.30% 1.12% 4.66% 5.38% 0.09% 1930-1949 1950 30.81% 1.20% 0.43% 4.24% 3.64% 1931 - 1950 1951 23.68% 1.52% -0.30% -0.19% 6.05% 1932-1951 1952 18.15% 1.72% 2.27% 4.44% 4.41% 1933-1952 1953 -1.21% 1.89% 4.14% 1.62% 11.52% 1934-1953 1954 52.56% 0.94% 3.29% 6.16% 0.92% 1935-1954 1955 32.60% 1.72% -1.34% 2.04% 0.00% 1936-1955 1956 7.44% 2.62% 1957 -10.46% 3.22% 1958 43.72% 1.77% 6.80% -2.10% 6.43% -2.26% -2.35% -0.72% 0.91% 1937-1956 2.72% 1938 - 1957 0.66% 1939-1958 1959 12.06% 3.39% -2.65% 1.57% 0.11% 1940-1959 1960 0.34% 2.87% 11.64% 6.66% 0.77% 1941-1960 1961 26.64% 2.35% 2.06% 5.10% 0.98% 1942 - 1961 1962 -8.81% 2.77% 5.69% 6.50% 0.32% 1943 - 1962 1963 22.61% 3.16% 1.68% 5.46% 2.14% 1944-1963 1964 16.42% 3.55% 3.73% 5.16% 1.26% 1945-1964 1965 12.40% 3.95% 0.72% 3.19% 1.66% 1946-1965 1966 -9.97% 4.86% 2.91% -3.45% 1.22% 1947-1966 1967 23.80% 4.29% -1.58% 0.90% 2.32% 1948-1967 1968 10.81% 5.34% 3.27% 4.85% 4.13% 1949-1968 1969 -8.24% 6.67% -5.01% -2.03% 6.99% 1950-1969 1970 3.56% 6.39% 16.75% 5.65% 8.22% 1951 - 1970 1971 14.22% 4.33% 1972 18.76% 4.06% 9.79% 2.82% 14.00% 4.24% 1952 - 1971 11.41% 2.98% 1953-1972 Year S&P 500 3-month Tbill 10-year Thond Baa Bond Real Estate 1928 43.81% 3.08% 0.84% 3.22% 1929 -8.30% 3.16% 3.02% 1930 -25.12% 4.55% 4.20% 4.54% 0.54% -4.30% 1.49% -2.06% 1931 -43.84% 2.31% -2.56% -15.68% -8.15% 1932 -8.64% 1.07% 8.79% 23.59% 1933 49.98% 0.96% -10.47% 1.86% 12.97% -3.81% 1934 -1.19% 0.28% 7.96% 18.82% 2.91% 1935 46.74% 0.17% 4.47% 13.31% 9.77% 1936 31.94% 0.17% 5.02% 11.38% 3.22% 1937 -35.34% 0.28% 1.38% -4.42% 2.56% 1938 29.28% 0.07% 4.21% 9.24% -0.87% 1939 -1.10% 0.05% 4.41% 7.98% -1.30% 1940 -10.67% 0.04% 5.40% 8.65% 3.31% 1941 -12.77% 0.13% -2.02% 5.01% -8.38% 1942 19.17% 0.34% 2.29% 5.18% 3.33% 1943 25.06% 0.38% 2.49% 8.04% 1944 19.03% 0.38% 1945 35.82% 0.38% 3.80% 2.58% 6.57% 6.80% 1946 -8.43% 0.38% 3.13% 2.51% 11.45% 16.58% 11.78% 24.10% Here is the solution for the first period. It's up to you to build the formula and solve for the remaining periods. 1947 5.20% 0.60% 0.92% 0.26% 21.26% Work Period S&P 500 3-month Tbill 10-year Tbond 1928 1947 $ 42,050.85 $ 21,026.90 $ 27,664.96 Baa Bond Real Estate $ 40,450.61 $ 40,669.91 1948 5.70% 1.05% 1.95% 3.44% 2.06% 1929-1948 1949 18.30% 1.12% 4.66% 5.38% 0.09% 1930-1949 1950 30.81% 1.20% 0.43% 4.24% 3.64% 1931 - 1950 1951 23.68% 1.52% -0.30% -0.19% 6.05% 1932-1951 1952 18.15% 1.72% 2.27% 4.44% 4.41% 1933-1952 1953 -1.21% 1.89% 4.14% 1.62% 11.52% 1934-1953 1954 52.56% 0.94% 3.29% 6.16% 0.92% 1935-1954 1955 32.60% 1.72% -1.34% 2.04% 0.00% 1936-1955 1956 7.44% 2.62% 1957 -10.46% 3.22% 1958 43.72% 1.77% 6.80% -2.10% 6.43% -2.26% -2.35% -0.72% 0.91% 1937-1956 2.72% 1938 - 1957 0.66% 1939-1958 1959 12.06% 3.39% -2.65% 1.57% 0.11% 1940-1959 1960 0.34% 2.87% 11.64% 6.66% 0.77% 1941-1960 1961 26.64% 2.35% 2.06% 5.10% 0.98% 1942 - 1961 1962 -8.81% 2.77% 5.69% 6.50% 0.32% 1943 - 1962 1963 22.61% 3.16% 1.68% 5.46% 2.14% 1944-1963 1964 16.42% 3.55% 3.73% 5.16% 1.26% 1945-1964 1965 12.40% 3.95% 0.72% 3.19% 1.66% 1946-1965 1966 -9.97% 4.86% 2.91% -3.45% 1.22% 1947-1966 1967 23.80% 4.29% -1.58% 0.90% 2.32% 1948-1967 1968 10.81% 5.34% 3.27% 4.85% 4.13% 1949-1968 1969 -8.24% 6.67% -5.01% -2.03% 6.99% 1950-1969 1970 3.56% 6.39% 16.75% 5.65% 8.22% 1951 - 1970 1971 14.22% 4.33% 1972 18.76% 4.06% 9.79% 2.82% 14.00% 4.24% 1952 - 1971 11.41% 2.98% 1953-1972
Expert Answer:

Posted Date:
Students also viewed these finance questions
-
A regression analysis resulted in the following information regarding a dependent variable (y) and an independent variable (x). n = 10 x = 55 y = 55 x2 = 385 y2 = 385 xy = 220 Refer to Exhibit. The...
-
Estimate the temperature at which GaAs has an electrical conductivity of 3.7 3 1023 (V-m)21 assuming the temperature dependence for of Equation 18.36. The data shown in Table 18.3 might prove...
-
What conflicts can occur as a result of the different objectives of budgeting?
-
Selected journal entries for the ( lilies Companj are presented in BE2-7. Post the transactions asms: the standard form oi account.
-
Dr. Lori Baker, operations manager at Nesa Electronics, prides herself on excellent assembly-line balancing. She has been told that the firm needs to complete 96 instruments per 24-hour day. The...
-
I need sin thetaCos theta Tan theta Csc theta Sec theta Cot theta 2 3 4 5 6 7 8 9 10 11 12 A point is given on the terminal side of an angle 0 drawn in standard position. Find the values of the six...
-
Sales are $2.44 million in 2020, $2.54 million in 2021, and $2.34 million in 2022. What is the percentage change from 2020 to 2021? What is the percentage change from 2021 to 2022? Be sure to...
-
How does process modeling contribute to the optimization of complex industrial systems, and what methodologies are typically employed to represent and simulate these processes ?
-
I have arranged to borrow $11,000 from my parents toward a holiday. I will repay the loan over 3 years in equal year-end payments. If the interest rate is 14.3% p.a. compounding monthly, my annual...
-
"Sales increased by 20%, so cash inflows must also have increased by 20%." Do you agree with this statement? Why or why not?
-
In our reading about Ethical Considerations, the authors of the text outline several ethical principles of communication. Which of these principles is the most important to our study of intercultural...
-
Evaluate the integral x' In(x) dx using integration by parts. Note: you must do this question completely by hand. Output from your calculator is not acceptable. au = du= dy= y= or f(x)= f(x)= b....
-
KrugerCo.'s merges into StoopsCo. under Delaware law. Prior to the merger, Kruger's assets are worth $5M with a basis of $3.2M. Kruger's has two shareholders: Lon: 85% ownership and Barbara: 15%. Lon...
-
Using a graphing utility, graph y = cot -1 x.
-
Use Fleury's algorithm to construct an Euler trail for the given graph beginning at vertex \(f\) of your choice. a d a 6 b
-
Use the graphs shown to determine whether the sequence of vertices \(d ightarrow b ightarrow c ightarrow f ightarrow e ightarrow d\) is a Hamilton cycle, an Euler circuit, both, or neither. C m n d e...
-
Use the figure shown to find the weight of the given Hamilton cycle: twxuy vs rqt 13 3 q r S 1 7 2 6 t u 14 15 12 11 8 5 W X 9 10

Study smarter with the SolutionInn App