

Question: year, x tuition, y The data in the chart show the cost of tuition at a state 0. (1997) 9804 university for the years 1997-2001.
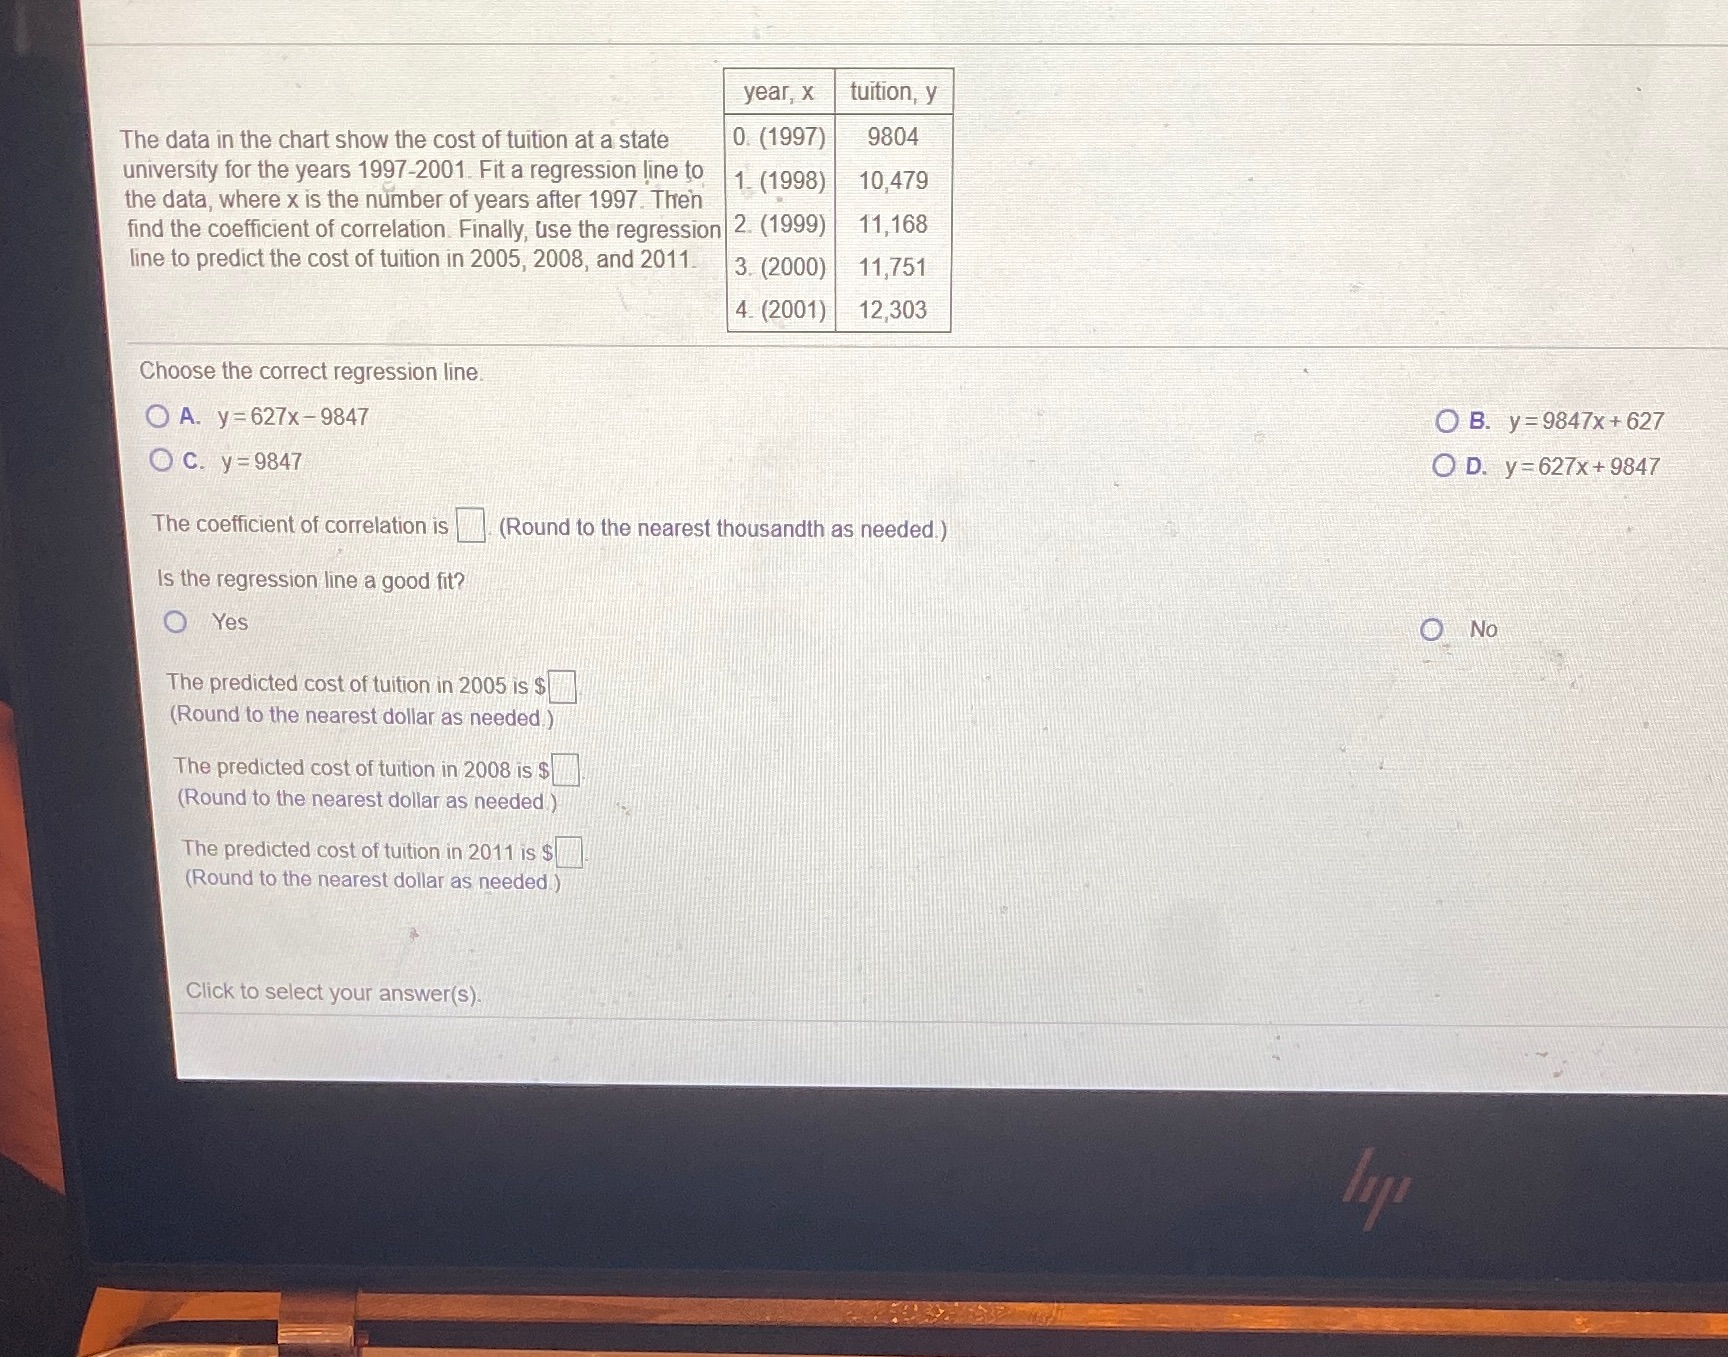
year, x tuition, y The data in the chart show the cost of tuition at a state 0. (1997) 9804 university for the years 1997-2001. Fit a regression line to the data, where x is the number of years after 1997. Then 1 (1998) 10,479 find the coefficient of correlation. Finally, use the regression 2. (1999) 11,168 line to predict the cost of tuition in 2005, 2008, and 2011. 3. (2000) 11,751 4. (2001) 12,303 Choose the correct regression line A. y=627x-9847 O B. y =9847x + 627 O C. y= 9847 O D. y=627x +9847 The coefficient of correlation is |(Round to the nearest thousandth as needed.) Is the regression line a good fit? Yes No The predicted cost of tuition in 2005 is $ (Round to the nearest dollar as needed ) The predicted cost of tuition in 2008 is $ (Round to the nearest dollar as needed ) The predicted cost of tuition in 2011 is $ (Round to the nearest dollar as needed.) Click to select your answer(s)
Step by Step Solution
There are 3 Steps involved in it

Get step-by-step solutions from verified subject matter experts