

Question: Yield Curves Referring to the data below, plot the yields on the grid provided. Connect the dots for each curve: Treasury, Corporates rated AA, and
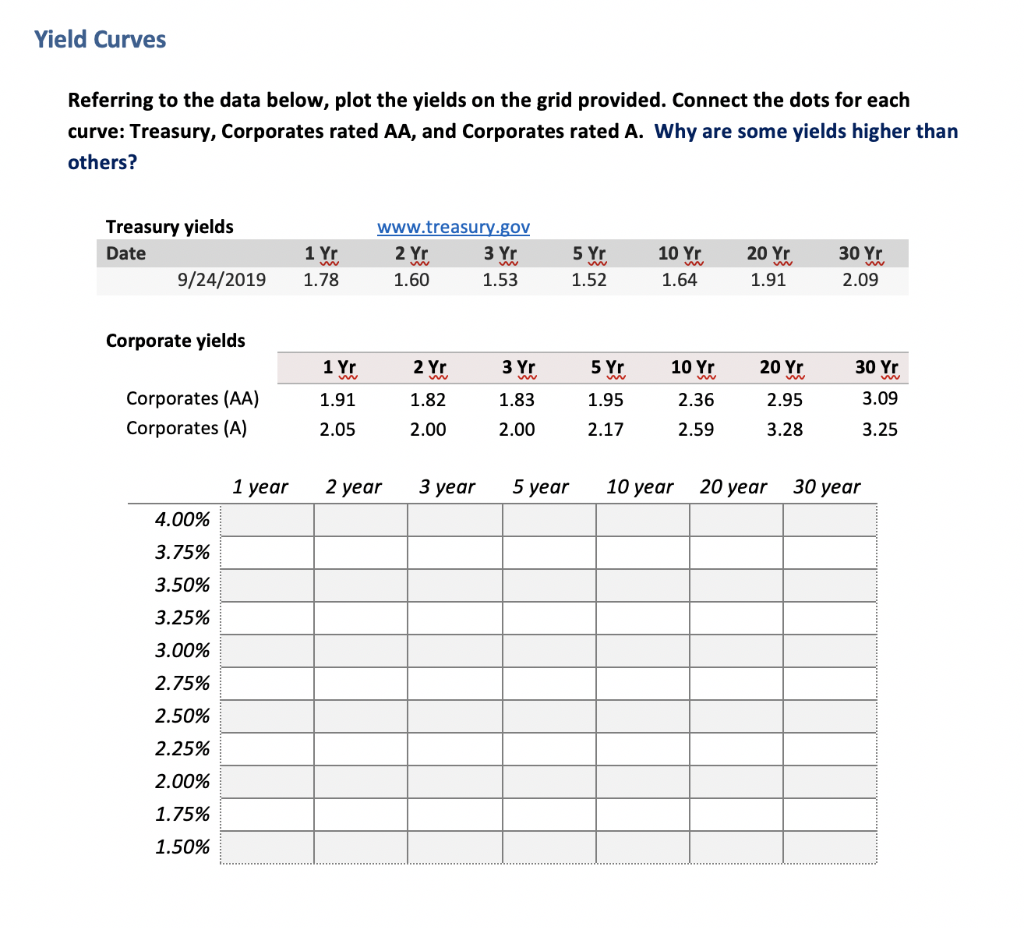
Yield Curves Referring to the data below, plot the yields on the grid provided. Connect the dots for each curve: Treasury, Corporates rated AA, and Corporates rated A. Why are some yields higher than others? Treasury yields Date 9/24/2019 1 Yr 1.78 www.treasury.gov 2 Yr 3 Yr 1.60 1.53 5 Yr 1.52 10 Yr 1.64 20 Yr 1.91 30 Yr 2.09 Corporate yields 1 Yr 2 Yr 3 Yr 5 Yr 10 Yr 20 Yr 30 Yr 1.91 1.82 1.83 1.95 2.36 2.95 3.09 Corporates (AA) Corporates (A) 2.05 2.00 2.00 2.17 2.59 3.28 3.25 1 year 2 year 3 year 5 year 10 year 20 year 30 year 4.00% 3.75% 3.50% 3.25% 3.00% 2.75% 2.50% 2.25% 2.00% 1.75% 1.50% Yield Curves Referring to the data below, plot the yields on the grid provided. Connect the dots for each curve: Treasury, Corporates rated AA, and Corporates rated A. Why are some yields higher than others? Treasury yields Date 9/24/2019 1 Yr 1.78 www.treasury.gov 2 Yr 3 Yr 1.60 1.53 5 Yr 1.52 10 Yr 1.64 20 Yr 1.91 30 Yr 2.09 Corporate yields 1 Yr 2 Yr 3 Yr 5 Yr 10 Yr 20 Yr 30 Yr 1.91 1.82 1.83 1.95 2.36 2.95 3.09 Corporates (AA) Corporates (A) 2.05 2.00 2.00 2.17 2.59 3.28 3.25 1 year 2 year 3 year 5 year 10 year 20 year 30 year 4.00% 3.75% 3.50% 3.25% 3.00% 2.75% 2.50% 2.25% 2.00% 1.75% 1.50%
Step by Step Solution
There are 3 Steps involved in it

Get step-by-step solutions from verified subject matter experts