

Question: Y/N G B IF E KIN The graph above represents the aggregate production function of a country, where Y/N is the per worker real output
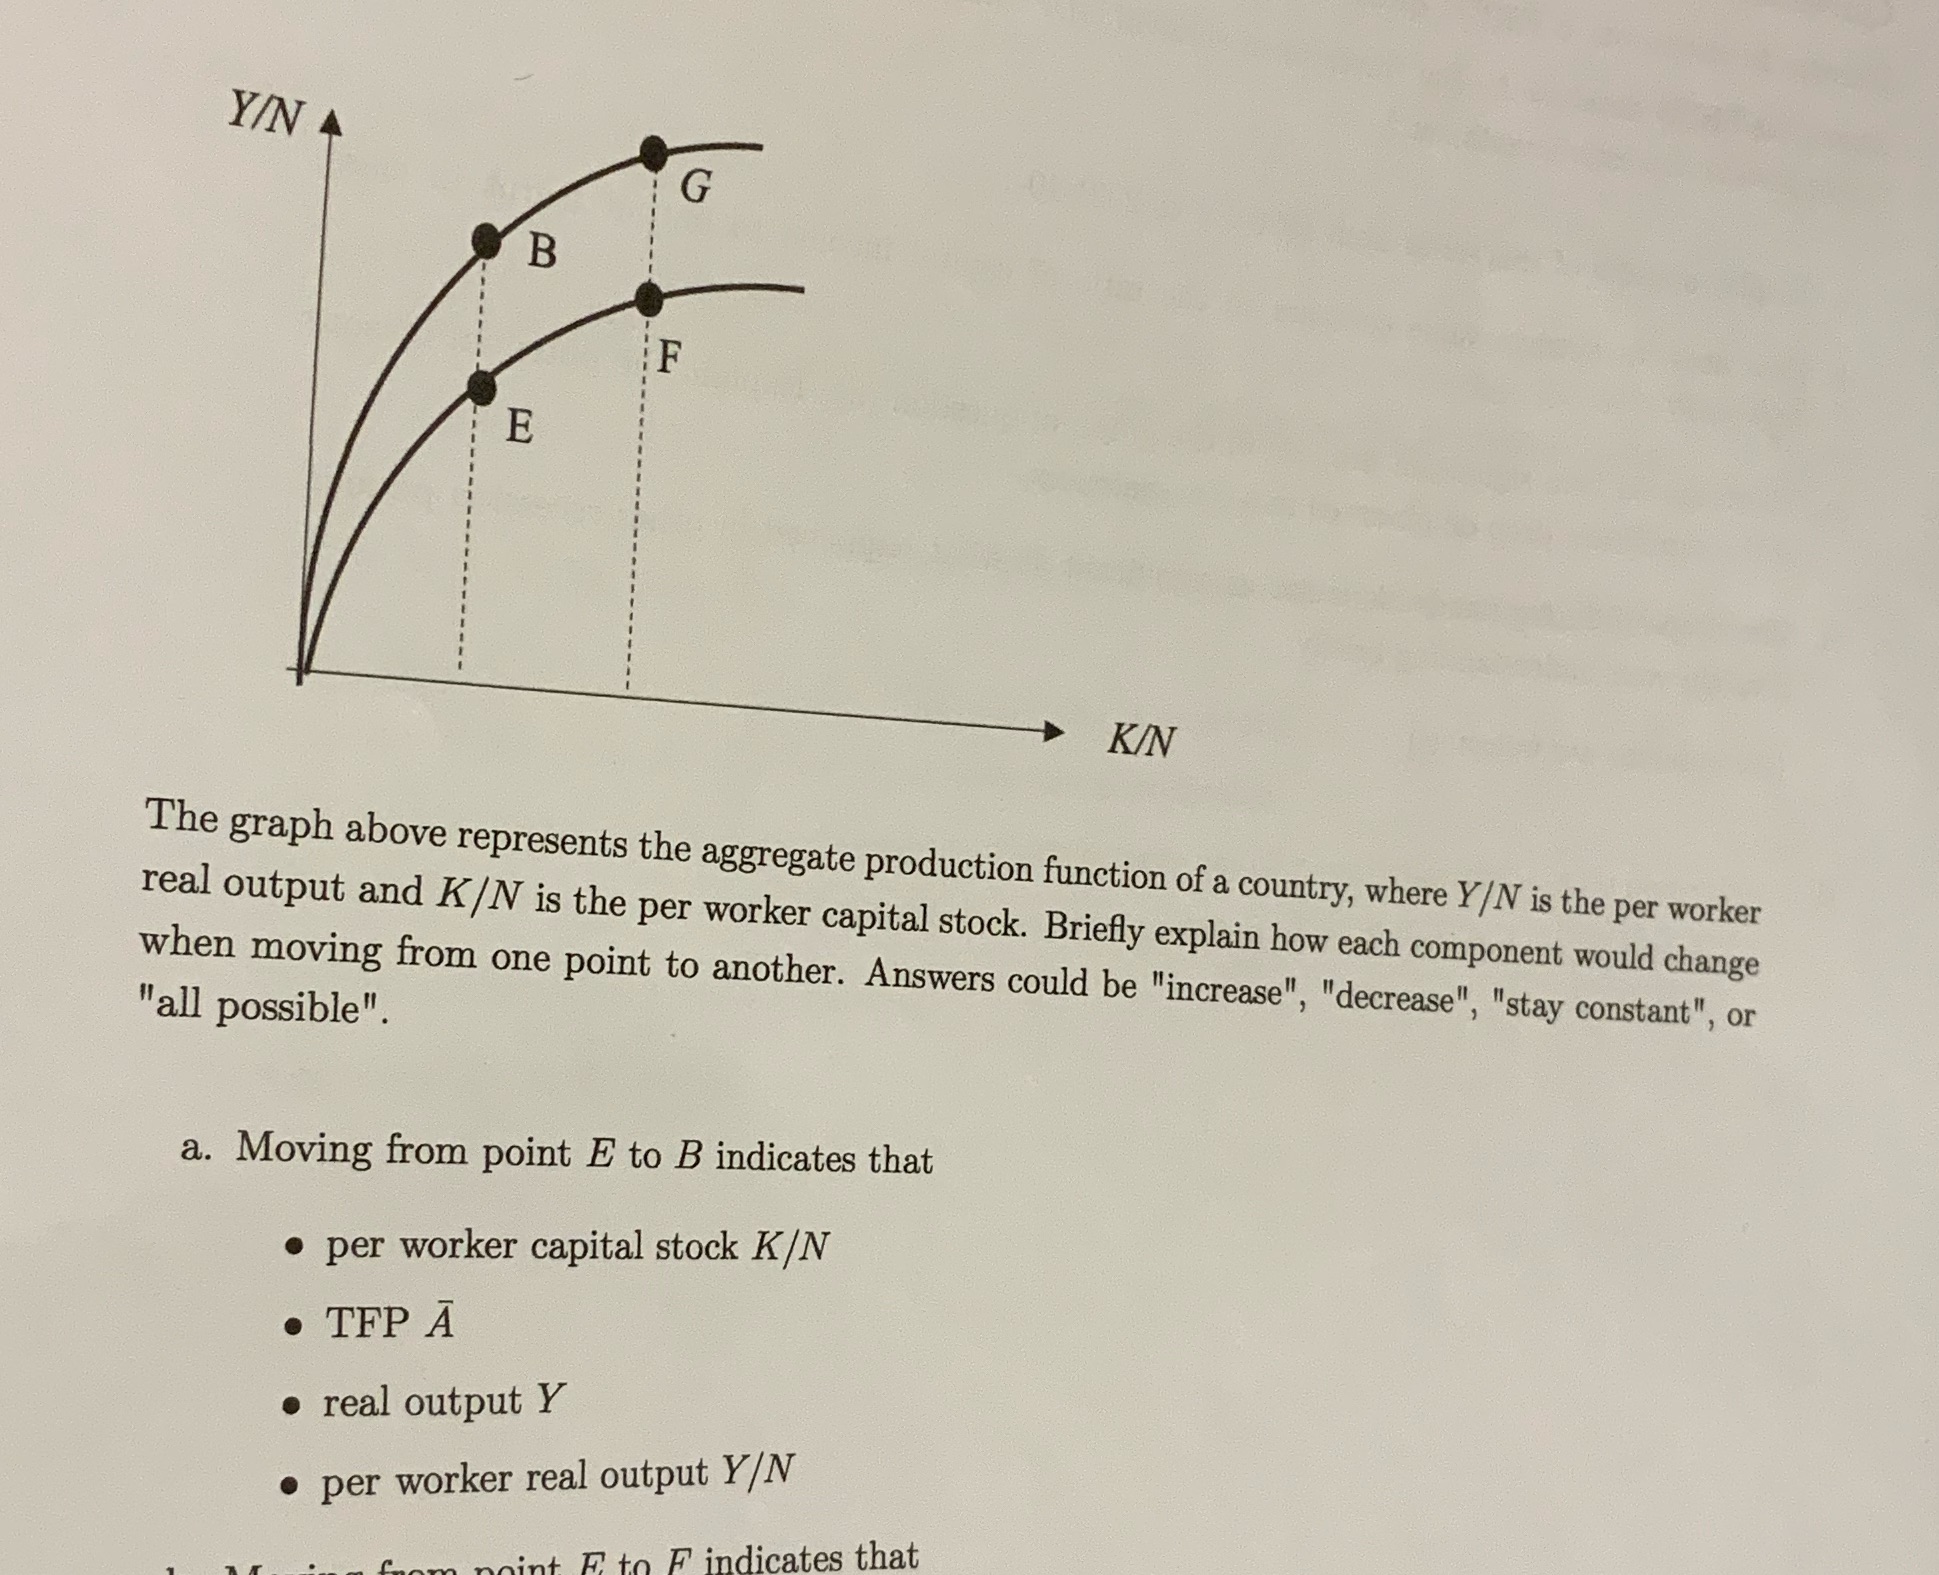
Y/N G B IF E KIN The graph above represents the aggregate production function of a country, where Y/N is the per worker real output and K/N is the per worker capital stock. Briefly explain how each component would change when moving from one point to another. Answers could be "increase", "decrease", "stay constant", or "all possible". a. Moving from point E to B indicates that . per worker capital stock K/N . TFP A . real output Y . per worker real output Y/N F indicates that
Step by Step Solution
There are 3 Steps involved in it
1 Expert Approved Answer
Step: 1 Unlock

Question Has Been Solved by an Expert!
Get step-by-step solutions from verified subject matter experts
Step: 2 Unlock
Step: 3 Unlock