

You are a consultant who has been hired to help the province of Nova Scotia establish...
Fantastic news! We've Found the answer you've been seeking!
Question:
Transcribed Image Text:
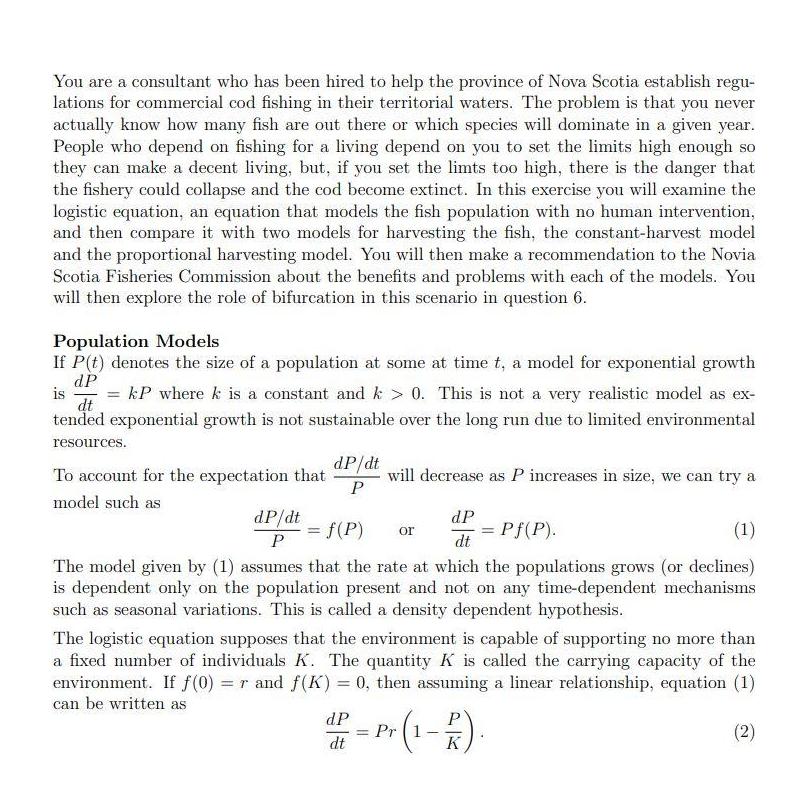
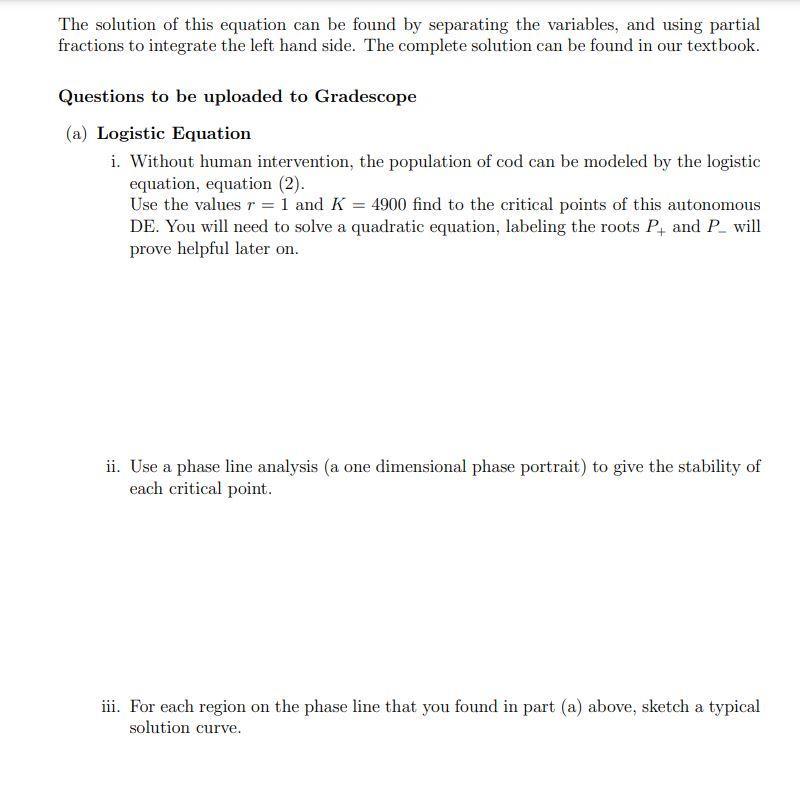
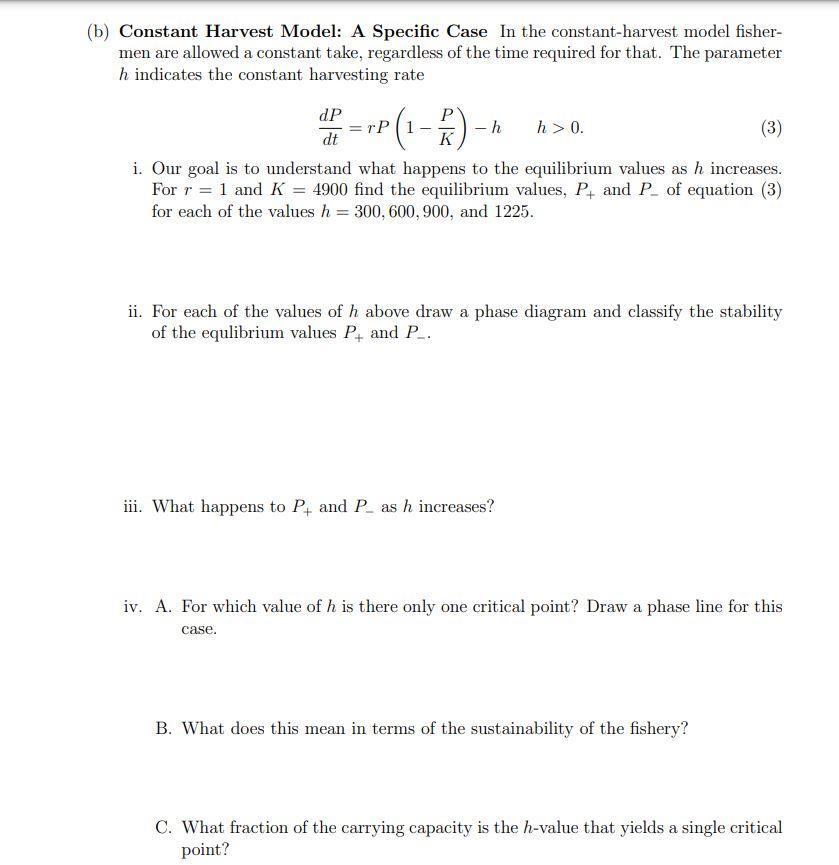
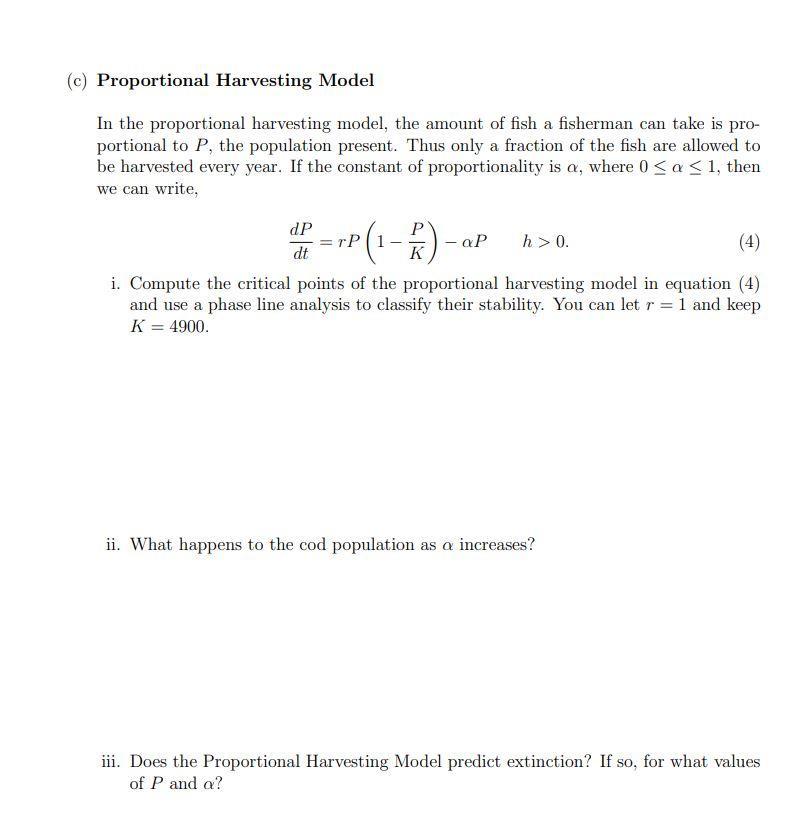
You are a consultant who has been hired to help the province of Nova Scotia establish regu- lations for commercial cod fishing in their territorial waters. The problem is that you never actually know how many fish are out there or which species will dominate in a given year. People who depend on fishing for a living depend on you to set the limits high enough so they can make a decent living, but, if you set the limts too high, there is the danger that the fishery could collapse and the cod become extinct. In this exercise you will examine the logistic equation, an equation that models the fish population with no human intervention, and then compare it with two models for harvesting the fish, the constant-harvest model and the proportional harvesting model. You will then make a recommendation to the Novia Scotia Fisheries Commission about the benefits and problems with each of the models. You will then explore the role of bifurcation in this scenario in question 6. Population Models If P(t) denotes the size of a population at some at time t, a model for exponential growth dP is = kP where k is a constant and k > 0. This is not a very realistic model as ex- dt tended exponential growth is not sustainable over the long run due to limited environmental resources. To account for the expectation that model such as dp/dt P dp/dt P will decrease as P increases in size, we can try a dᏢ dt = f(P) or (1) The model given by (1) assumes that the rate at which the populations grows (or declines) is dependent only on the population present and not on any time-dependent mechanisms such as seasonal variations. This is called a density dependent hypothesis. dP dt = Pf(P). The logistic equation supposes that the environment is capable of supporting no more than a fixed number of individuals K. The quantity K is called the carrying capacity of the environment. If f(0) = r and f(K) = 0, then assuming a linear relationship, equation (1) can be written as P (₁-2). K = Pr 1 (2) The solution of this equation can be found by separating the variables, and using partial fractions to integrate the left hand side. The complete solution can be found in our textbook. Questions to be uploaded to Gradescope (a) Logistic Equation i. Without human intervention, the population of cod can be modeled by the logistic equation, equation (2). Use the values r = 1 and K = 4900 find to the critical points of this autonomous DE. You will need to solve a quadratic equation, labeling the roots P+ and P_ will prove helpful later on. ii. Use a phase line analysis (a one dimensional phase portrait) to give the stability of each critical point. iii. For each region on the phase line that you found in part (a) above, sketch a typical solution curve. (b) Constant Harvest Model: A Specific Case In the constant-harvest model fisher- men are allowed a constant take, regardless of the time required for that. The parameter h indicates the constant harvesting rate 2- +P (1-P)- K dP (3) i. Our goal is to understand what happens to the equilibrium values as h increases. For r = 1 and K = 4900 find the equilibrium values, P and P_ of equation (3) for each of the values h = 300, 600, 900, and 1225. - h h> 0. dt ii. For each of the values of h above draw a phase diagram and classify the stability of the equlibrium values P and P_. iii. What happens to P and P. as h increases? iv. A. For which value of h is there only one critical point? Draw a phase line for this case. B. What does this mean in terms of the sustainability of the fishery? C. What fraction of the carrying capacity is the h-value that yields a single critical point? (c) Proportional Harvesting Model In the proportional harvesting model, the amount of fish a fisherman can take is pro- portional to P, the population present. Thus only a fraction of the fish are allowed to be harvested every year. If the constant of proportionality is a, where 0 ≤ a ≤ 1, then we can write, dP =rP (1-2)-ap K h > 0. i. Compute the critical points of the proportional harvesting model in equation (4) and use a phase line analysis to classify their stability. You can let r= 1 and keep K = 4900. ii. What happens to the cod population as a increases? iii. Does the Proportional Harvesting Model predict extinction? If so, for what values of P and a? (d) Conclusions Now it is time to prepare your report and suggest a policy for cod fishing to the Nova Scotia Department of Fisheries. Which would you recommend and why? (e) Bifurcations The model dealing with constant harvesting provides an example of bifurcation. A bifurcation is essentially a dramatic change in the qualitative structure of the phase line, such as the appearance or disappearance of a critical point. A critical point of an autonomous DE ' = f(x) is said to be hyperbolic if small pertubations of f(x) do not change the qualitative structure of the DE and nonhyperbolic if arbitrary small changes do change the nature of the system. A bifurcation diagram for a family of DEs is a graph that shows the location and stability of the critical points for each parameter, in our case h the harvesting rate. Consider our example r = = 1 and K 4900. The critical points satisfy = dP dt P (₁ - / / ) - K = TP 1 - h = 0, and these can be solved using the quadratic formula. i. Plot the graph of P vs h from (5) for 0 <h ≤ 1225. (5) ii. What is the bifurcation poinit and what does it tell you about the limits on h if the goal is a sustainable fishery? You are a consultant who has been hired to help the province of Nova Scotia establish regu- lations for commercial cod fishing in their territorial waters. The problem is that you never actually know how many fish are out there or which species will dominate in a given year. People who depend on fishing for a living depend on you to set the limits high enough so they can make a decent living, but, if you set the limts too high, there is the danger that the fishery could collapse and the cod become extinct. In this exercise you will examine the logistic equation, an equation that models the fish population with no human intervention, and then compare it with two models for harvesting the fish, the constant-harvest model and the proportional harvesting model. You will then make a recommendation to the Novia Scotia Fisheries Commission about the benefits and problems with each of the models. You will then explore the role of bifurcation in this scenario in question 6. Population Models If P(t) denotes the size of a population at some at time t, a model for exponential growth dP is = kP where k is a constant and k > 0. This is not a very realistic model as ex- dt tended exponential growth is not sustainable over the long run due to limited environmental resources. To account for the expectation that model such as dp/dt P dp/dt P will decrease as P increases in size, we can try a dᏢ dt = f(P) or (1) The model given by (1) assumes that the rate at which the populations grows (or declines) is dependent only on the population present and not on any time-dependent mechanisms such as seasonal variations. This is called a density dependent hypothesis. dP dt = Pf(P). The logistic equation supposes that the environment is capable of supporting no more than a fixed number of individuals K. The quantity K is called the carrying capacity of the environment. If f(0) = r and f(K) = 0, then assuming a linear relationship, equation (1) can be written as P (₁-2). K = Pr 1 (2) The solution of this equation can be found by separating the variables, and using partial fractions to integrate the left hand side. The complete solution can be found in our textbook. Questions to be uploaded to Gradescope (a) Logistic Equation i. Without human intervention, the population of cod can be modeled by the logistic equation, equation (2). Use the values r = 1 and K = 4900 find to the critical points of this autonomous DE. You will need to solve a quadratic equation, labeling the roots P+ and P_ will prove helpful later on. ii. Use a phase line analysis (a one dimensional phase portrait) to give the stability of each critical point. iii. For each region on the phase line that you found in part (a) above, sketch a typical solution curve. (b) Constant Harvest Model: A Specific Case In the constant-harvest model fisher- men are allowed a constant take, regardless of the time required for that. The parameter h indicates the constant harvesting rate 2- +P (1-P)- K dP (3) i. Our goal is to understand what happens to the equilibrium values as h increases. For r = 1 and K = 4900 find the equilibrium values, P and P_ of equation (3) for each of the values h = 300, 600, 900, and 1225. - h h> 0. dt ii. For each of the values of h above draw a phase diagram and classify the stability of the equlibrium values P and P_. iii. What happens to P and P. as h increases? iv. A. For which value of h is there only one critical point? Draw a phase line for this case. B. What does this mean in terms of the sustainability of the fishery? C. What fraction of the carrying capacity is the h-value that yields a single critical point? (c) Proportional Harvesting Model In the proportional harvesting model, the amount of fish a fisherman can take is pro- portional to P, the population present. Thus only a fraction of the fish are allowed to be harvested every year. If the constant of proportionality is a, where 0 ≤ a ≤ 1, then we can write, dP =rP (1-2)-ap K h > 0. i. Compute the critical points of the proportional harvesting model in equation (4) and use a phase line analysis to classify their stability. You can let r= 1 and keep K = 4900. ii. What happens to the cod population as a increases? iii. Does the Proportional Harvesting Model predict extinction? If so, for what values of P and a? (d) Conclusions Now it is time to prepare your report and suggest a policy for cod fishing to the Nova Scotia Department of Fisheries. Which would you recommend and why? (e) Bifurcations The model dealing with constant harvesting provides an example of bifurcation. A bifurcation is essentially a dramatic change in the qualitative structure of the phase line, such as the appearance or disappearance of a critical point. A critical point of an autonomous DE ' = f(x) is said to be hyperbolic if small pertubations of f(x) do not change the qualitative structure of the DE and nonhyperbolic if arbitrary small changes do change the nature of the system. A bifurcation diagram for a family of DEs is a graph that shows the location and stability of the critical points for each parameter, in our case h the harvesting rate. Consider our example r = = 1 and K 4900. The critical points satisfy = dP dt P (₁ - / / ) - K = TP 1 - h = 0, and these can be solved using the quadratic formula. i. Plot the graph of P vs h from (5) for 0 <h ≤ 1225. (5) ii. What is the bifurcation poinit and what does it tell you about the limits on h if the goal is a sustainable fishery?
Expert Answer:

Related Book For 

Business Communication Process and Product
ISBN: 978-0324542905
6th Edition
Authors: Mary Ellen Guffey
Posted Date:
Students also viewed these mathematics questions
-
You are a consultant who has been hired to improve the effectiveness of corporate trainers. These trainers frequently make presentations to employees on topics such as conflict management, teamwork,...
-
You are a security consultant who has been hired to evaluate security at the Crown Food Mart in Alorton, Illinois. As part of your community and perimeter preparation, what can you learn that would...
-
You are a fraud examiner who has been hired by Bellevue Company to carry out an investigation. Bellevue is a beverage company that has experienced increased shipments of beverages but no increase in...
-
Let Find x , y , xy , and yx , and state the domain for each partial derivative. f(x, y) = [y, y = 0 1-y, y < 0.
-
Do you agree that the units-of-production method always results in more rapid depreciation of an asset than does the straight-line method? Explain.
-
Tommy Sharp was an electrical and instrumentation (E&I) designer for Aker Plant Services Group. Sharp began working for Aker as a contract employee in 2003, and then as a full-time employee in 2005....
-
Water flows from a two-dimensional open channel and is diverted by an inclined plate as illustrated in Fig. P5.78. When the velocity at section (1) is \(10 \mathrm{ft} / \mathrm{s}\), what horizontal...
-
In the course of producing its output, a firm causes pollution. The government passes a law that requires the firm to stop polluting, and the firm discovers that it can prevent the pollution by...
-
What are some of the biggest challenges and changes in trends for Human Resources due to the COVID-19 pandemic which has organizations in flux since 2020 especially with employees working remotely?
-
A parallel chord Howe truss is loaded as shown. Determine the force in members GI, GJ, and HJ.
-
Design a 3-bit Flash ADC and what will be the encoder binary output for Vin = 3.5V if the Vref = 6V.
-
Describe the strategic implications of self-driving cars or robotics on traditional companies.
-
How is HR Planning linked to a companys strategic goals? If a company is expecting 50% growth per year for 3 years, how can trend analysis be used to determine HR demand? Is ration analysis helpful...
-
A trader at a bank takes a call from a customer interested in buying a $50.00 straddle. The current stock price is $49.00, the interest rate is 6%, the implied volatility is 40%, and there are 90...
-
What is a virtual machine? 2. What is a Java Virtual Machine? 3. What is Java bytecode? 4. What is the relationship between Java Virtual Machines and Java bytecode? 5. If you were invited to a class...
-
Analyze how the various pandemic-related factors have shaped US trade, and how they affected consumer prices and the US economy. (Include concrete examples and provide your references)
-
You are the manager of a firm producing soft-drinks. Your accounts department gives you the following information. The price of soft-drink of the other firms in the market is SAR 5. Output Price...
-
The age-old saying for investing is "buy low and sell high," but this is easier said than done. Investors who panic about falling prices sell their investments, which in turn lowers the price and...
-
Writing a Survey: Studying Employee Use of Instant Messaging Instant messaging (IM) is a popular way to exchange messages in real time. It offers the convenience of telephone conversations and...
-
One of the biggest problems of student writers is paraphrasing secondary sources correctly to avoid plagiarism. Your Task. For each of the following, read the original passage. Analyze the...
-
What should you remember to do at the close of an interview?
-
What are a manager's resources?
-
What are the three levels of management?
-
Joe Maddon has been the manager of the Chicago Cubs since 2015. In his first year, he exceeded the expectations of most analysts and fans by leading the team to an appearance in the National League...

Study smarter with the SolutionInn App