

Question: You are asked to evaluate the performance of two classification models, M1 and M2. The following table shows the probabilities obtained by applying the models
You are asked to evaluate the performance of two classification models, M1 and M2. The following table shows the probabilities obtained by applying the models to the test set:
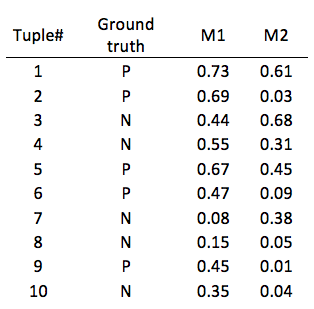
Plot the ROC curve for both M1 and M2. Show all the intermediate calculations as we discussed in the class. That includes calculations for TP, FP, TN, FN, TPR, and FPR. The use of spreadsheet (MS Excel) is allowed but not R. You should plot M1 and M2 on the same graph. Which model do you think is better? Explain your reasons
Ground M M2 Tuple# truth 1 0.73 0.61 0.69 0.03 0.44 0.68 0.55 0.31 0.67 0.45 0.47 0.09 0.08 0.38 0.15 0.05 0.45 0.01 0.35 0.04 4 6 10
Step by Step Solution
There are 3 Steps involved in it

Get step-by-step solutions from verified subject matter experts