

Question: You are asked to formulate and implement a Dynamic Programming algorithm that can be used to solve for an optimal maintenance and reconstruction policy for
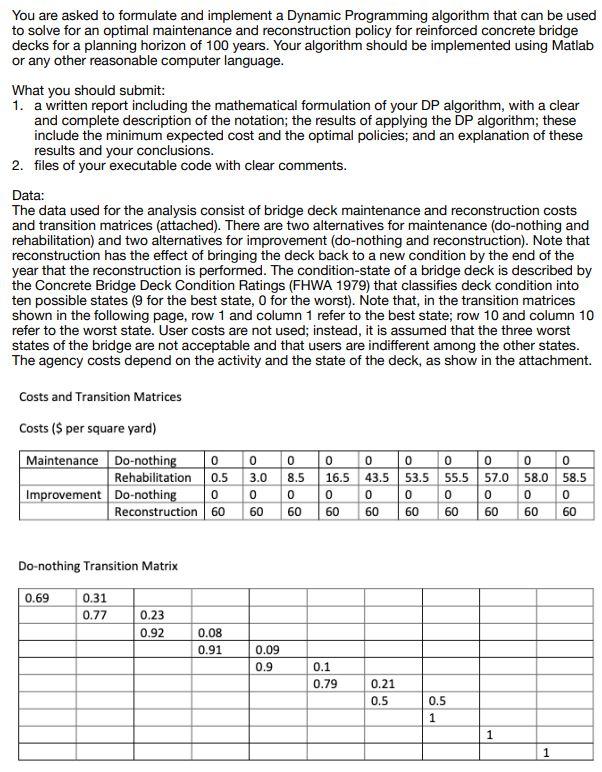
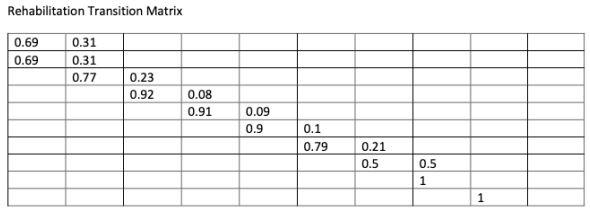
You are asked to formulate and implement a Dynamic Programming algorithm that can be used to solve for an optimal maintenance and reconstruction policy for reinforced concrete bridge decks for a planning horizon of 100 years. Your algorithm should be implemented using Matlab or any other reasonable computer language. What you should submit: 1. a written report including the mathematical formulation of your DP algorithm, with a clear and complete description of the notation; the results of applying the DP algorithm; these include the minimum expected cost and the optimal policies; and an explanation of these results and your conclusions. 2. files of your executable code with clear comments. Data: The data used for the analysis consist of bridge deck maintenance and reconstruction costs and transition matrices (attached). There are two alternatives for maintenance (do-nothing and rehabilitation) and two alternatives for improvement (do-nothing and reconstruction). Note that reconstruction has the effect of bringing the deck back to a new condition by the end of the year that the reconstruction is performed. The condition-state of a bridge deck is described by the Concrete Bridge Deck Condition Ratings (FHWA 1979) that classifies deck condition into ten possible states (9 for the best state, 0 for the worst). Note that, in the transition matrices shown in the following page, row 1 and column 1 refer to the best state; row 10 and column 10 refer to the worst state. User costs are not used; instead, it is assumed that the three worst states of the bridge are not acceptable and that users are indifferent among the other states. The agency costs depend on the activity and the state of the deck, as show in the attachment. Costs and Transition Matrices Costs ($ per square yard) Maintenance Do-nothing 0 Rehabilitation Improvement Do-nothing Reconstruction 60 0.5 0 0 0 3.0 8.5 0 0 60 60 0 16.5 0 60 0 43.5 0 60 0 53.5 0 60 0 55.5 0 60 0 57.0 o 60 0 58.0 o 60 0 58.5 0 60 Do-nothing Transition Matrix 0.69 0.31 0.77 0.23 0.92 0.08 0.91 0.09 0.9 0.1 0.79 0.21 0.5 0.5 1 1 1 Rehabilitation Transition Matrix 0.69 0.69 0.31 0.31 0.77 0.23 0.92 0.08 0.91 0.09 0.9 0.1 0.79 0.21 0.5 0.5 1 1 You are asked to formulate and implement a Dynamic Programming algorithm that can be used to solve for an optimal maintenance and reconstruction policy for reinforced concrete bridge decks for a planning horizon of 100 years. Your algorithm should be implemented using Matlab or any other reasonable computer language. What you should submit: 1. a written report including the mathematical formulation of your DP algorithm, with a clear and complete description of the notation; the results of applying the DP algorithm; these include the minimum expected cost and the optimal policies; and an explanation of these results and your conclusions. 2. files of your executable code with clear comments. Data: The data used for the analysis consist of bridge deck maintenance and reconstruction costs and transition matrices (attached). There are two alternatives for maintenance (do-nothing and rehabilitation) and two alternatives for improvement (do-nothing and reconstruction). Note that reconstruction has the effect of bringing the deck back to a new condition by the end of the year that the reconstruction is performed. The condition-state of a bridge deck is described by the Concrete Bridge Deck Condition Ratings (FHWA 1979) that classifies deck condition into ten possible states (9 for the best state, 0 for the worst). Note that, in the transition matrices shown in the following page, row 1 and column 1 refer to the best state; row 10 and column 10 refer to the worst state. User costs are not used; instead, it is assumed that the three worst states of the bridge are not acceptable and that users are indifferent among the other states. The agency costs depend on the activity and the state of the deck, as show in the attachment. Costs and Transition Matrices Costs ($ per square yard) Maintenance Do-nothing 0 Rehabilitation Improvement Do-nothing Reconstruction 60 0.5 0 0 0 3.0 8.5 0 0 60 60 0 16.5 0 60 0 43.5 0 60 0 53.5 0 60 0 55.5 0 60 0 57.0 o 60 0 58.0 o 60 0 58.5 0 60 Do-nothing Transition Matrix 0.69 0.31 0.77 0.23 0.92 0.08 0.91 0.09 0.9 0.1 0.79 0.21 0.5 0.5 1 1 1 Rehabilitation Transition Matrix 0.69 0.69 0.31 0.31 0.77 0.23 0.92 0.08 0.91 0.09 0.9 0.1 0.79 0.21 0.5 0.5 1 1
Step by Step Solution
There are 3 Steps involved in it

Get step-by-step solutions from verified subject matter experts