

Question: You are conducting a multinomial hypothesis test (o = 0.05) for the claim that all 5 categories are equally likely to be selected. Complete the

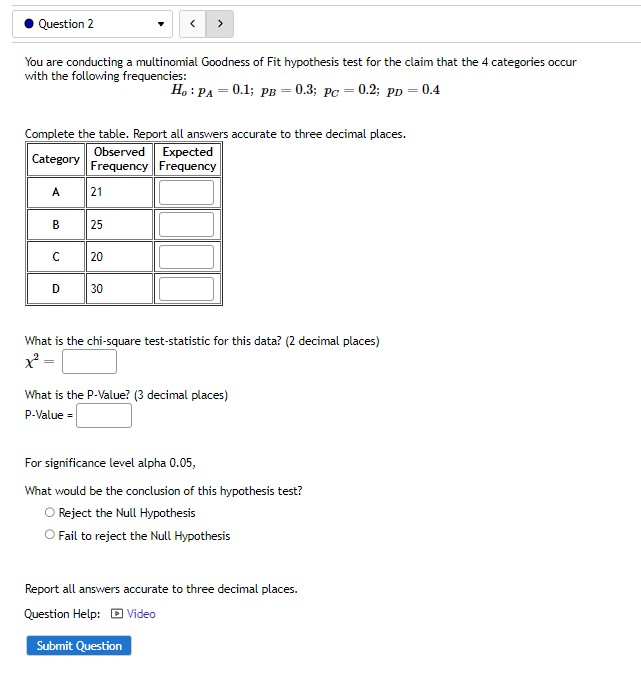

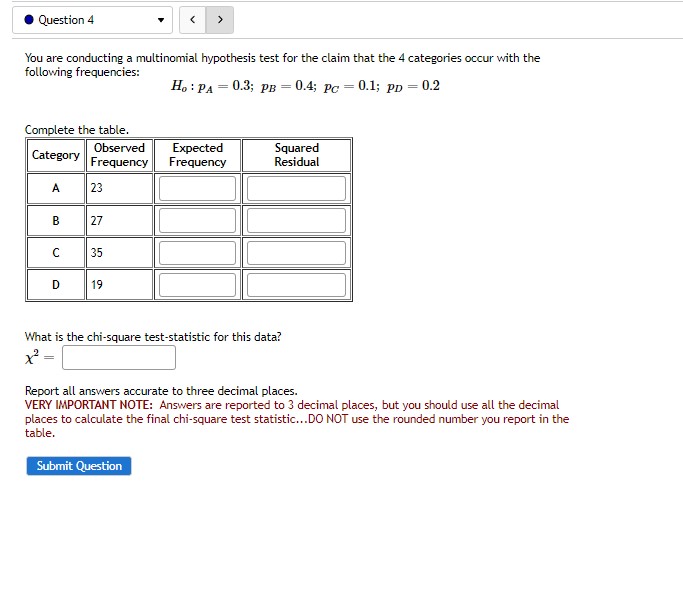

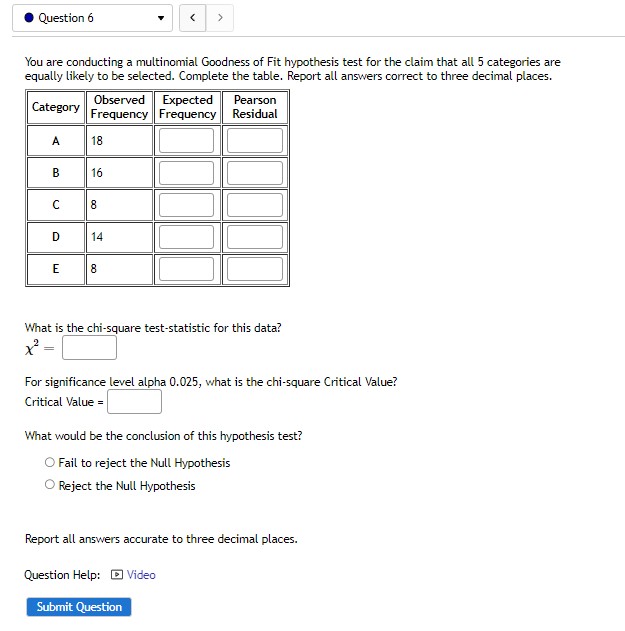
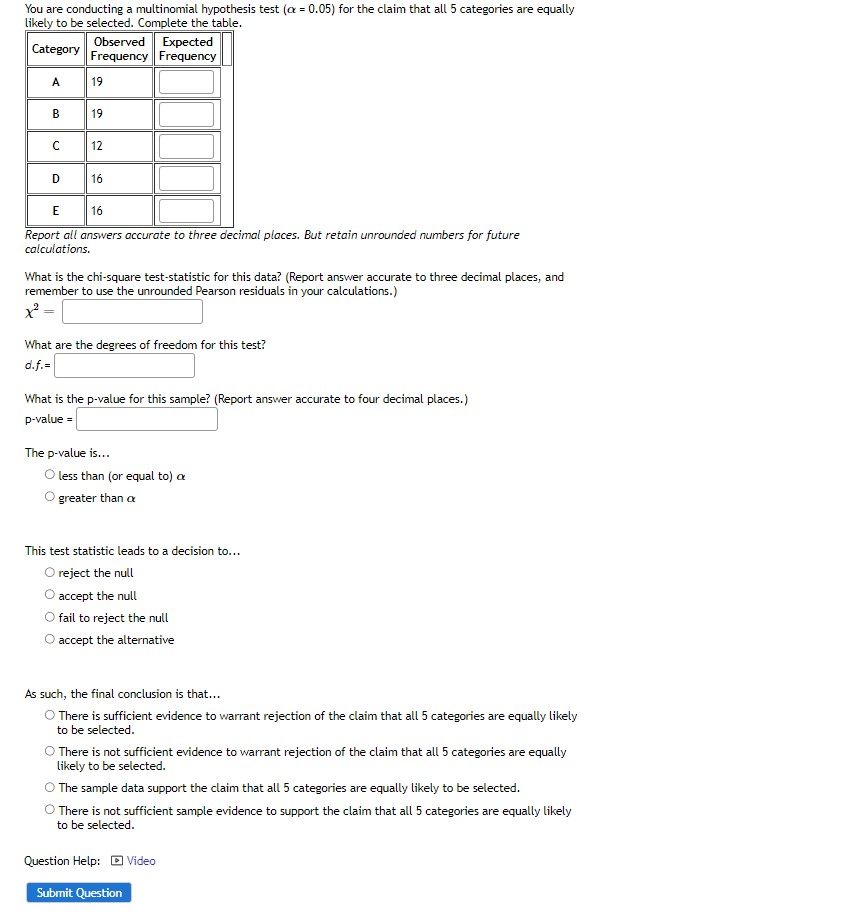

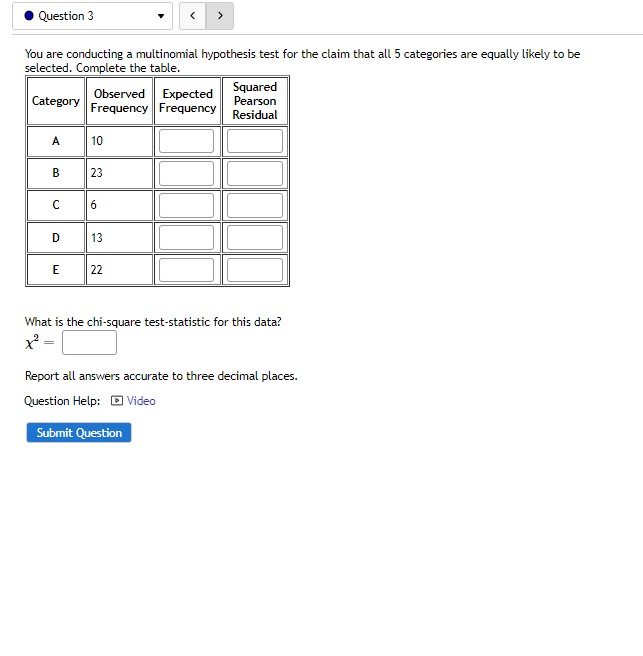

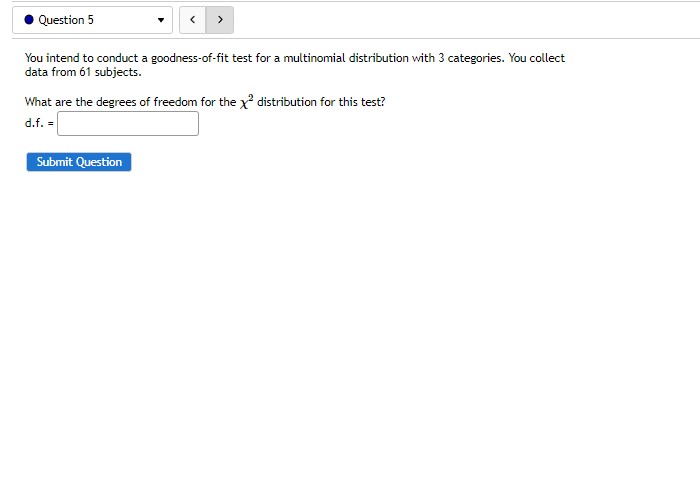

You are conducting a multinomial hypothesis test (o = 0.05) for the claim that all 5 categories are equally likely to be selected. Complete the table, Category Observed Expected Frequency |Frequency C D 16 F 16 Report all answers accurate to three decimal places. But retain unrounded numbers for future calculations. What is the chi-square test-statistic for this data? (Report answer accurate to three decimal places, and remember to use the unrounded Pearson residuals in your calculations.) x = What are the degrees of freedom for this test? d. f.= What is the p-value for this sample? (Report answer accurate to four decimal places. ) p-value = The p-value is... O less than (or equal to) o O greater than o This test statistic leads to a decision to... O reject the null O accept the null O fail to reject the null O accept the alternative As such, the final conclusion is that... There is sufficient evidence to warrant rejection of the claim that all 5 categories are equally likely to be selected. O There is not sufficient evidence to warrant rejection of the claim that all 5 categories are equally likely to be selected. O The sample data support the claim that all 5 categories are equally likely to be selected. There is not sufficient sample evidence to support the claim that all 5 categories are equally likely to be selected. Question Help: Video Submit Question. Question 2 You are conducting a multinomial Goodness of Fit hypothesis test for the claim that the 4 categories occur with the following frequencies: Ho : PA = 0.1; PB = 0.3; pc = 0.2; PD = 0.4 Complete the table. Report all answers accurate to three decimal places. Observed Expected Category Frequency Frequency A 21 B 25 C 20 D 30 What is the chi-square test-statistic for this data? (2 decimal places) What is the P-Value? (3 decimal places) P-Value = For significance level alpha 0.05, What would be the conclusion of this hypothesis test? O Reject the Null Hypothesis O Fail to reject the Null Hypothesis Report all answers accurate to three decimal places. Question Help: @ Video Submit QuestionQuestion 3 You are conducting a multinomial hypothesis test for the claim that all 5 categories are equally likely to be selected. Complete the table. Squared Category Observed Expected Frequency Frequency Pearson Residual A 10 B 23 C 13 E 22 What is the chi-square test-statistic for this data? Report all answers accurate to three decimal places. Question Help: Video Submit QuestionQuestion 4 You are conducting a multinomial hypothesis test for the claim that the 4 categories occur with the following frequencies: Ho : PA = 0.3; PB = 0.4; pc = 0.1; PD = 0.2 Complete the table. Observed Expected Squared Category Frequency Frequency Residual A 23 B 27 C 35 D 19 What is the chi-square test-statistic for this data? Report all answers accurate to three decimal places. VERY IMPORTANT NOTE: Answers are reported to 3 decimal places, but you should use all the decimal places to calculate the final chi-square test statistic...DO NOT use the rounded number you report in the table. Submit QuestionI Question 5 I-
Step by Step Solution
There are 3 Steps involved in it

Get step-by-step solutions from verified subject matter experts