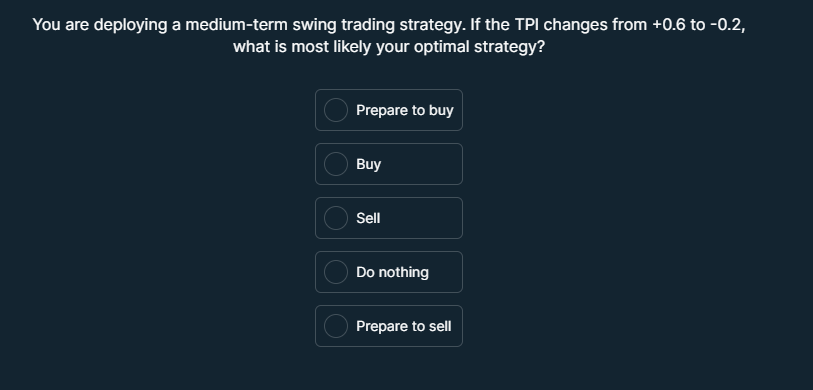
Question: You are deploying a medium-term swing trading strategy. If the TPl changes from +0.6 to -0.2, what is most likely your optimal strategy? Prepare to
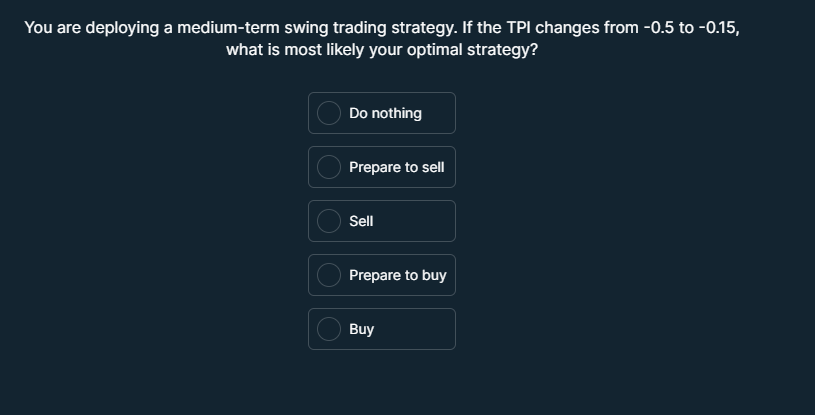
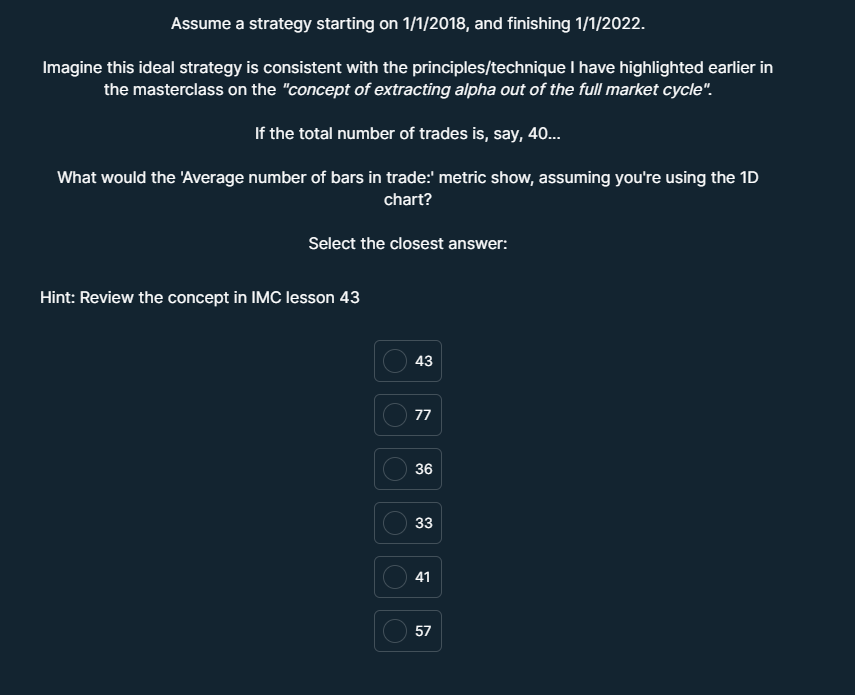
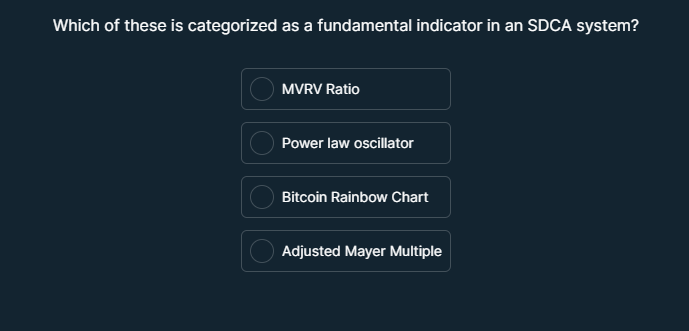
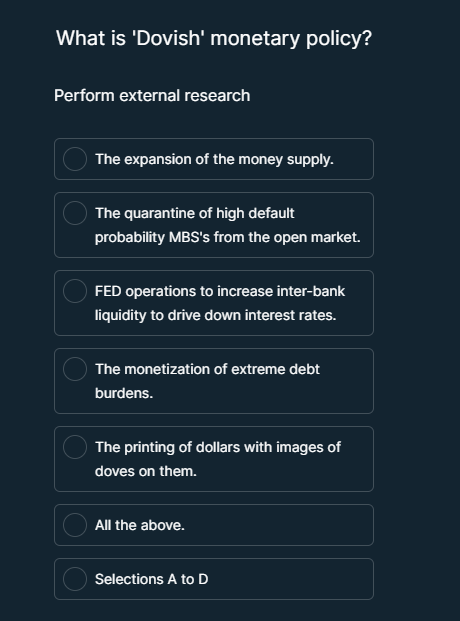
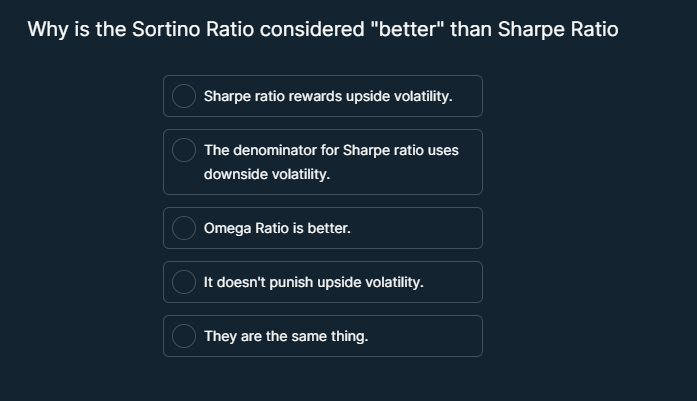
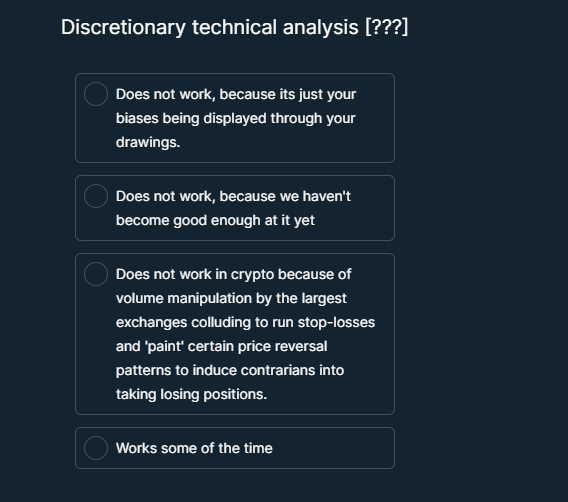
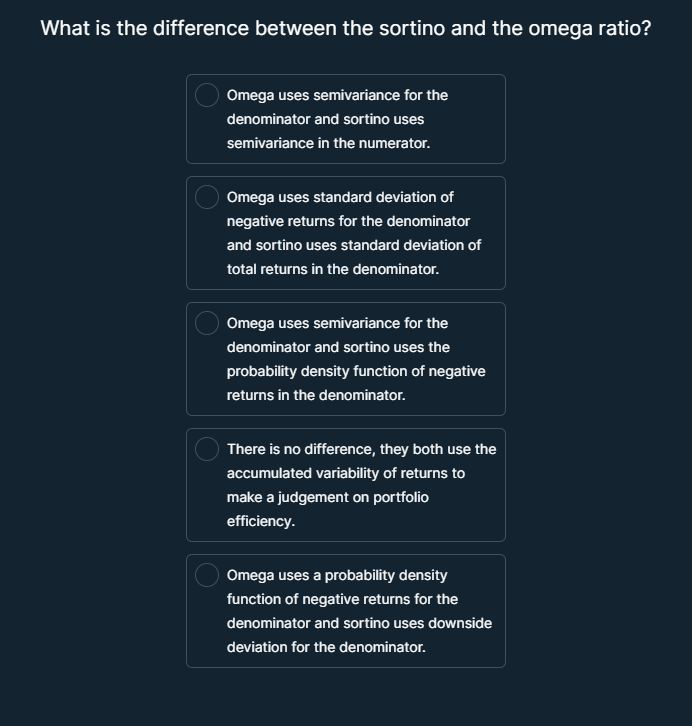
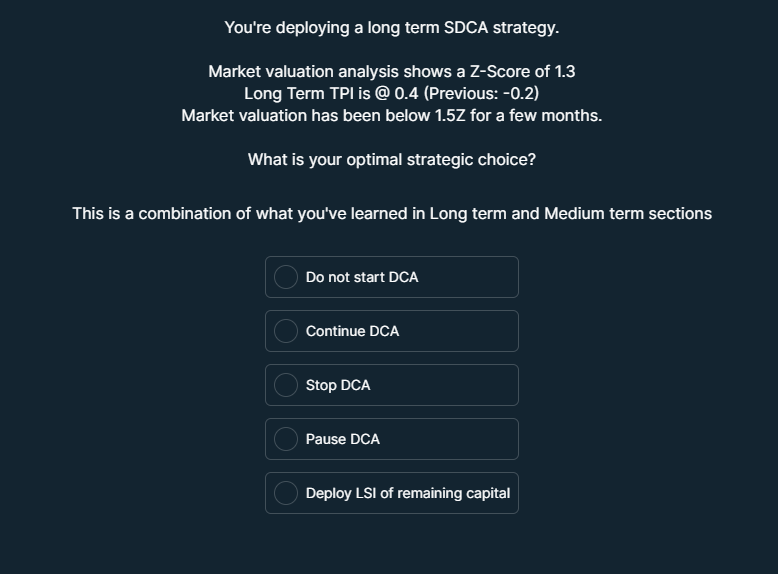
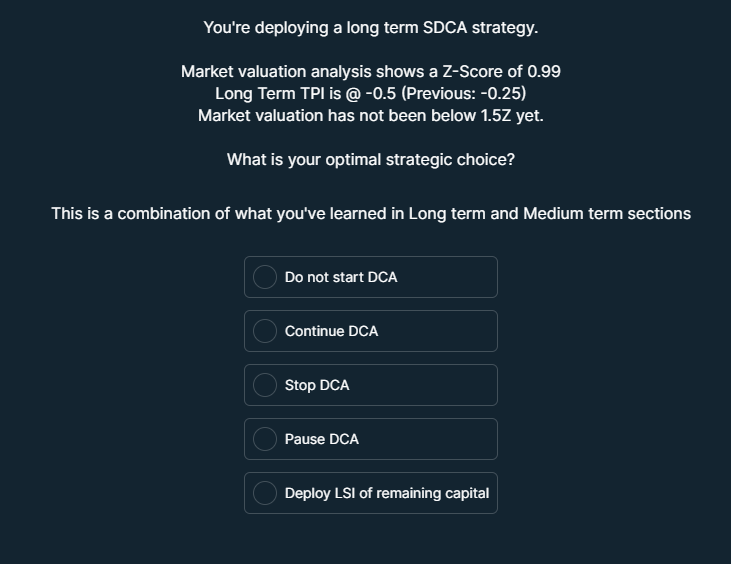
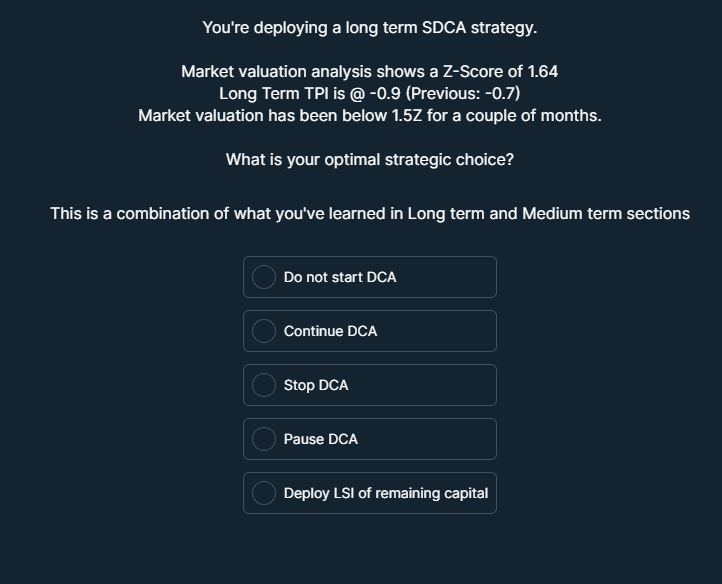
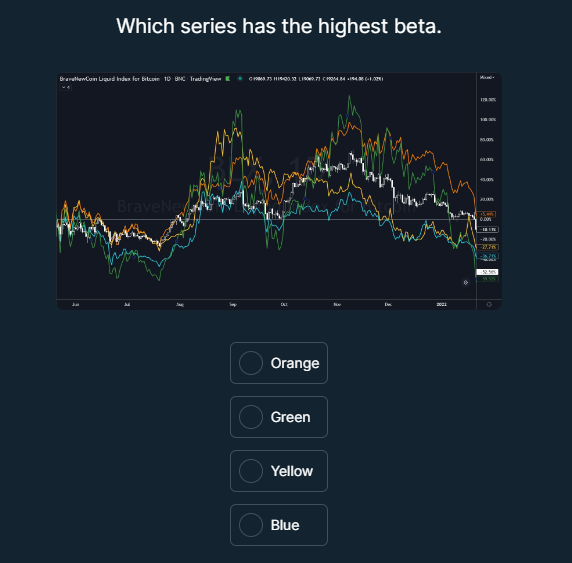
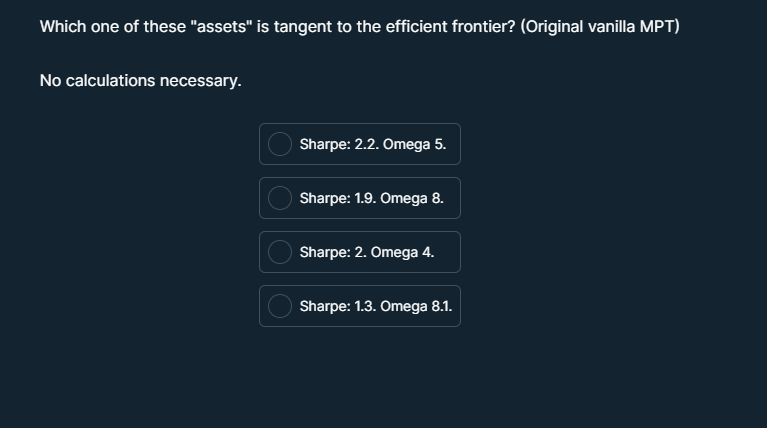
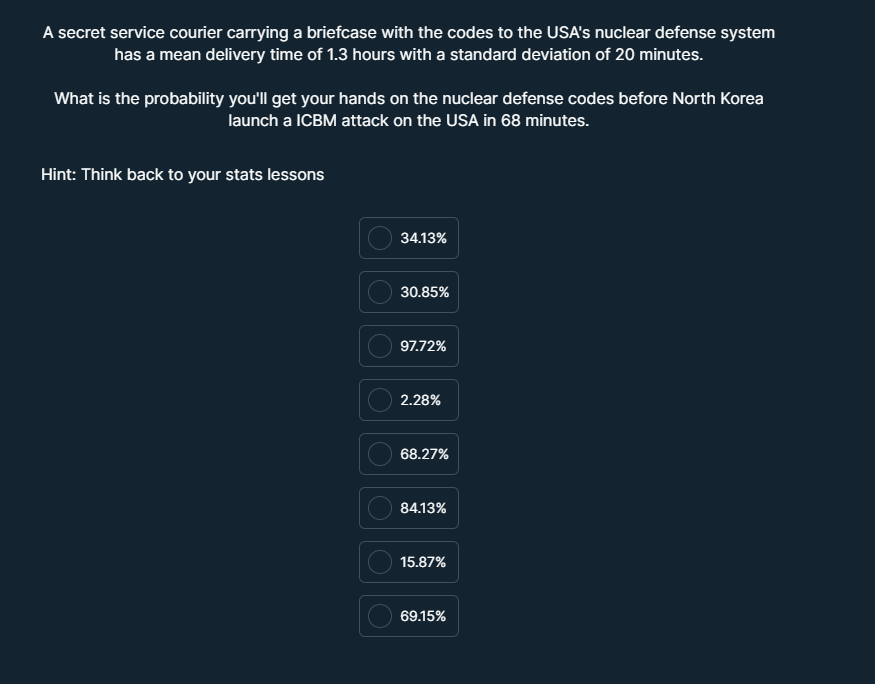
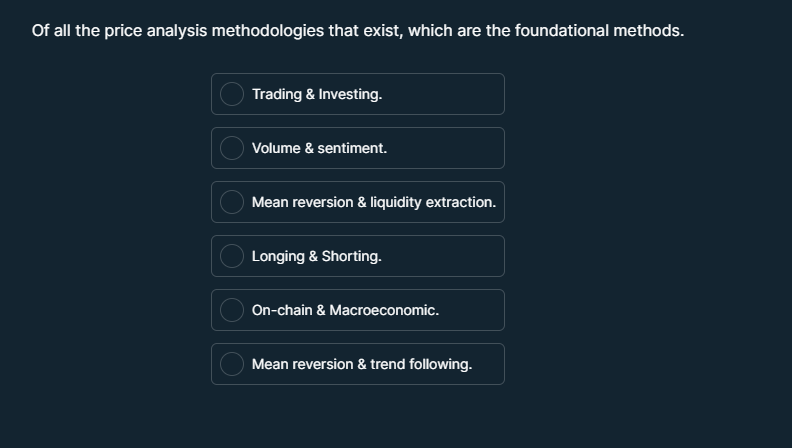
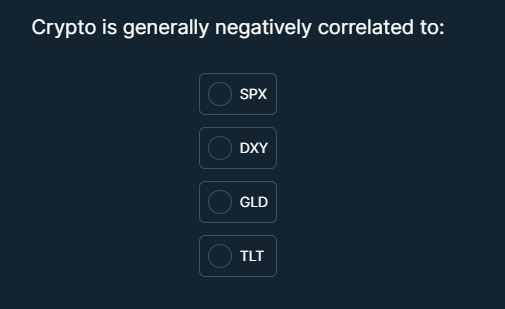
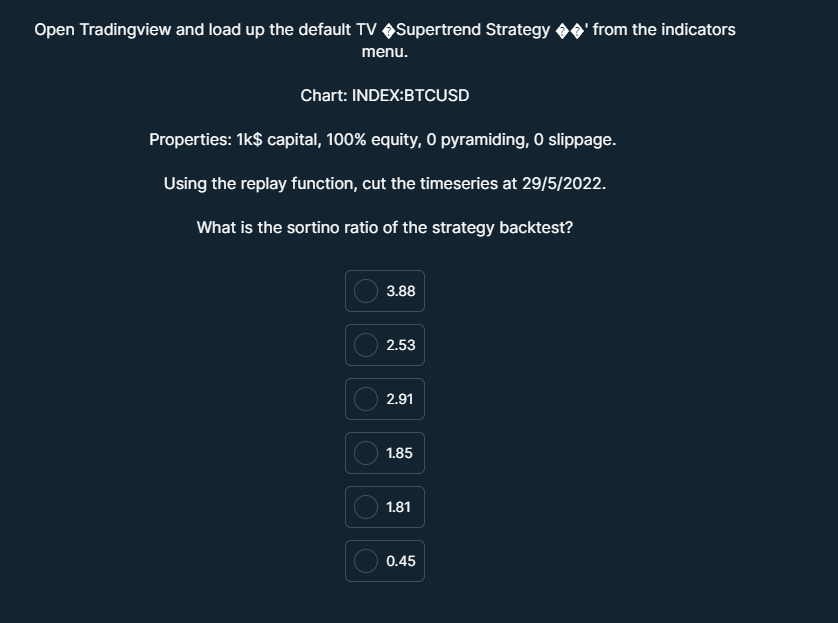
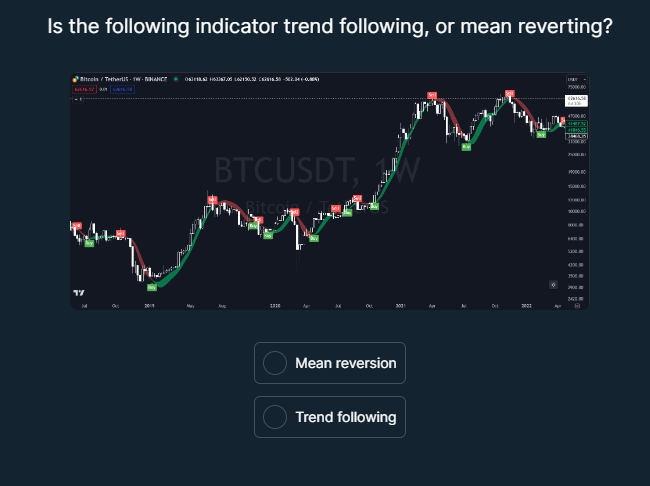
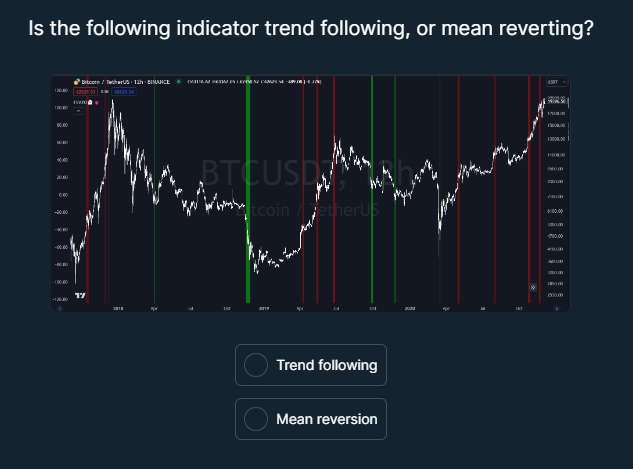
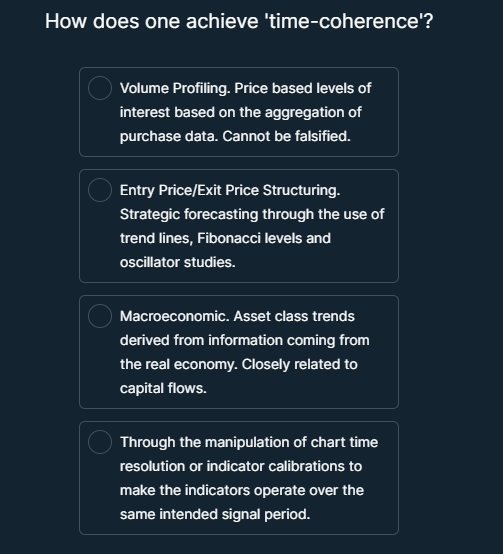
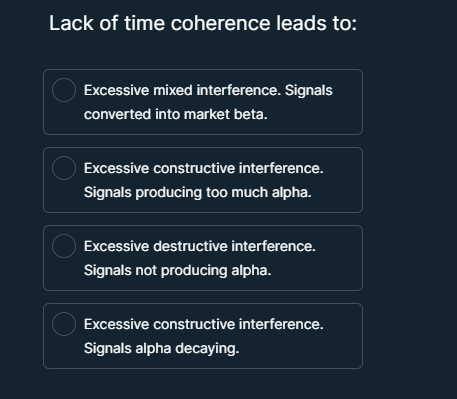
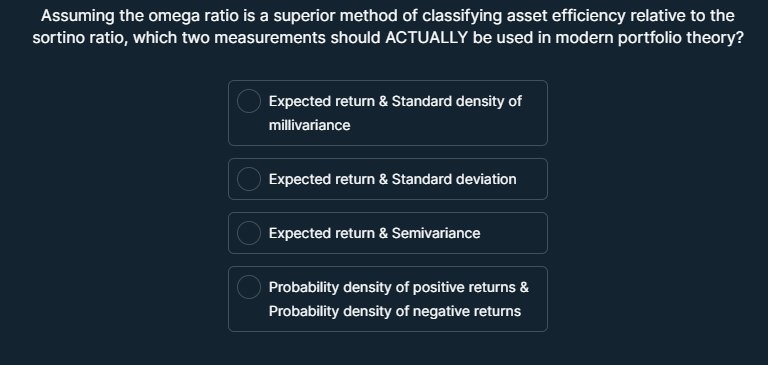
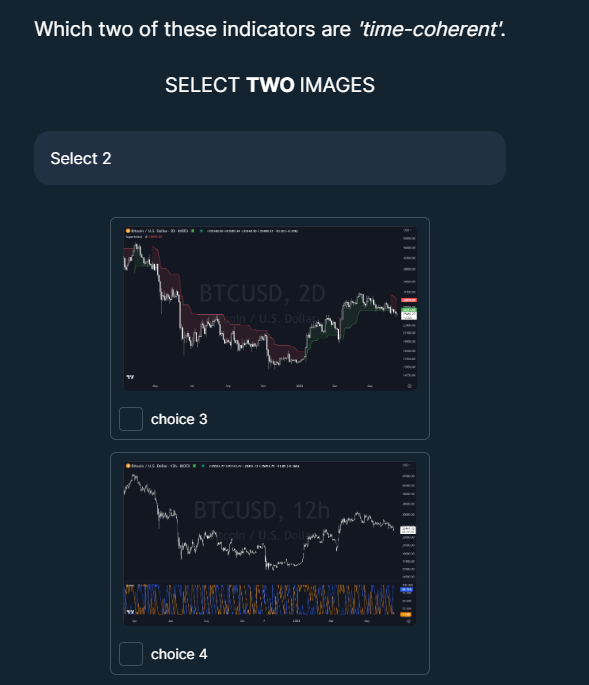
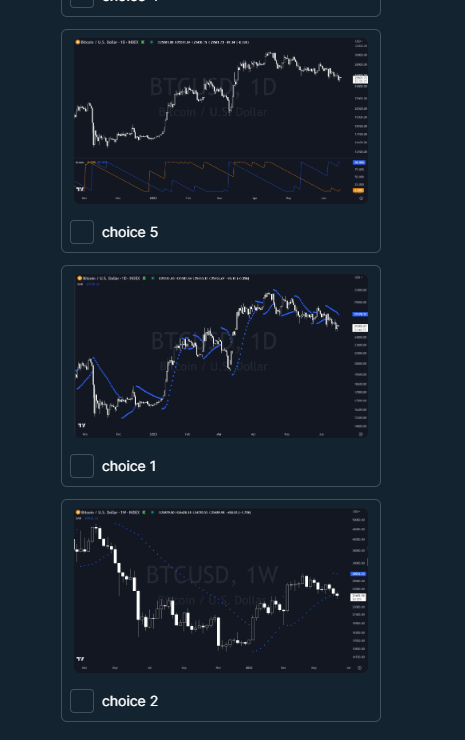
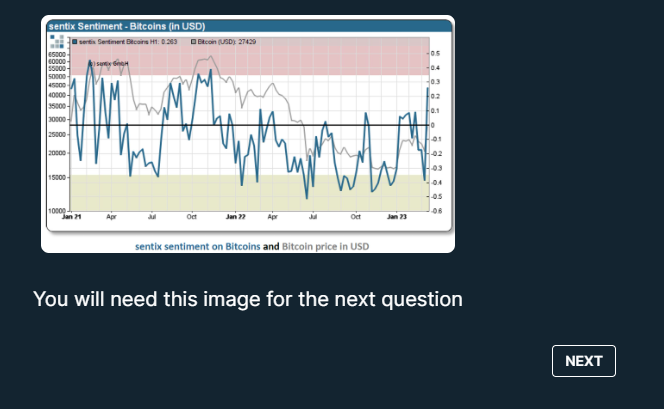
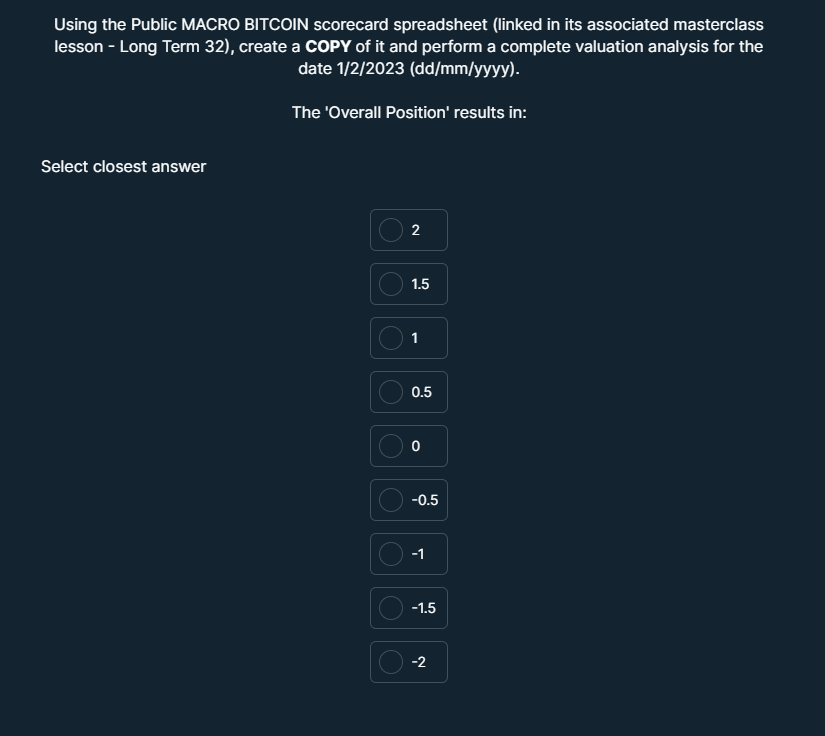
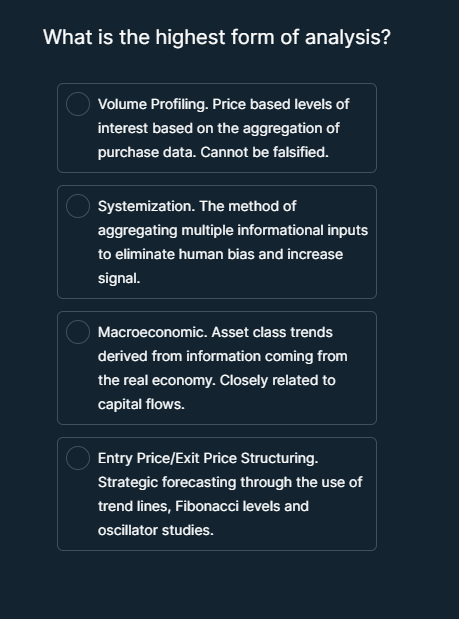
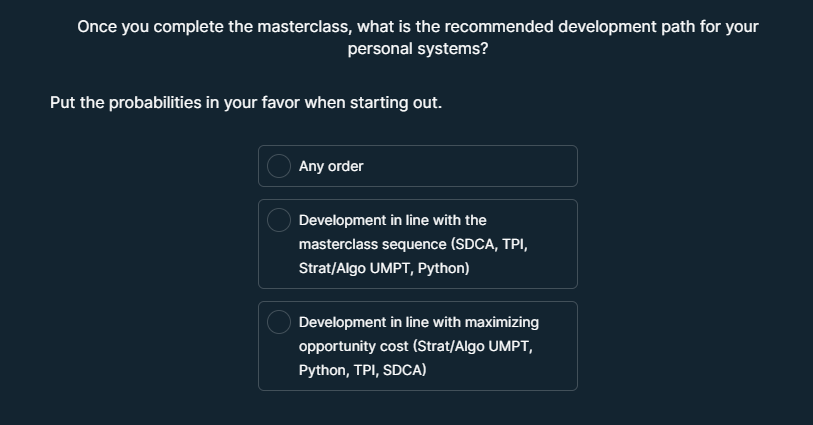
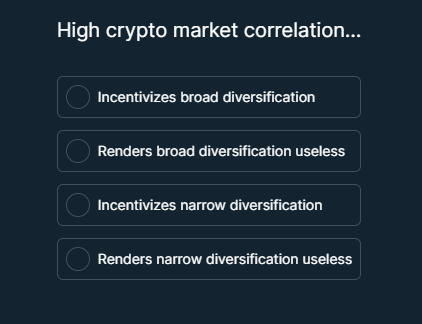
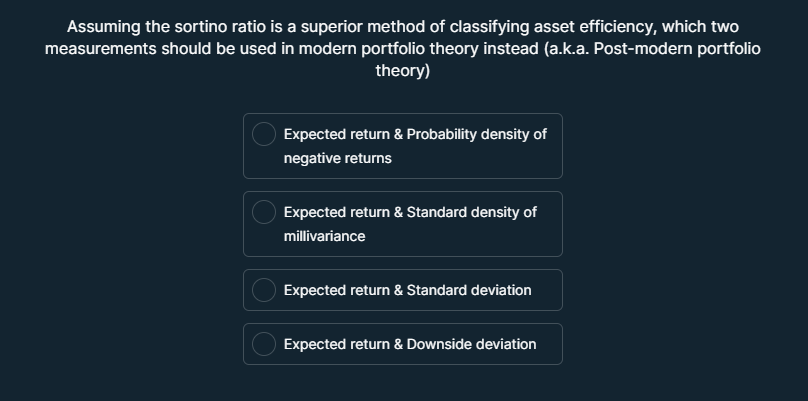
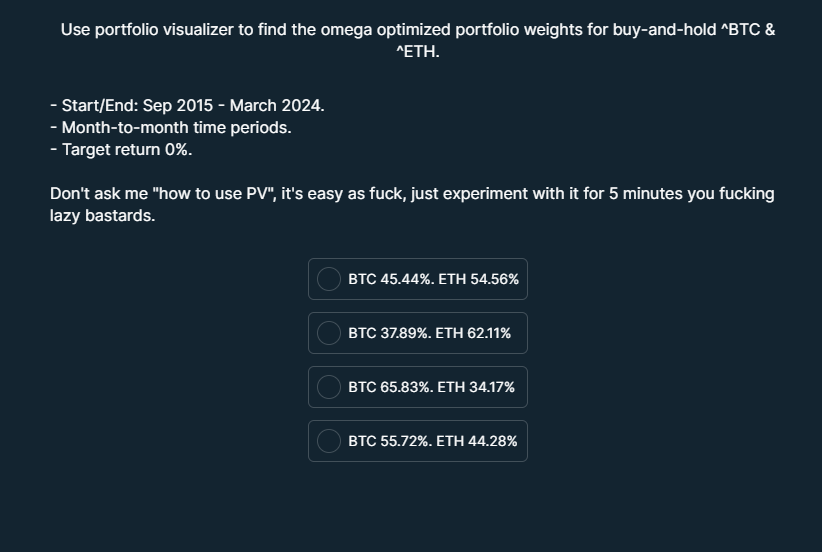
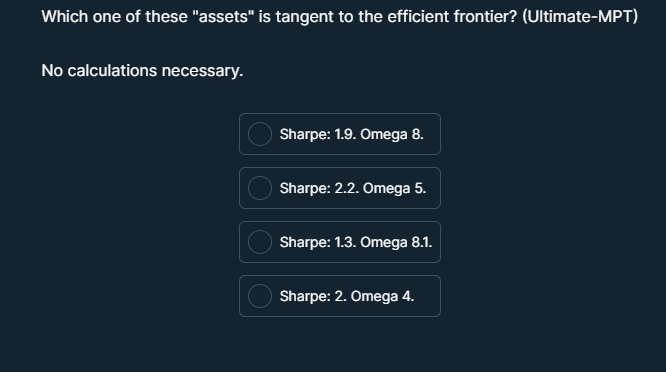
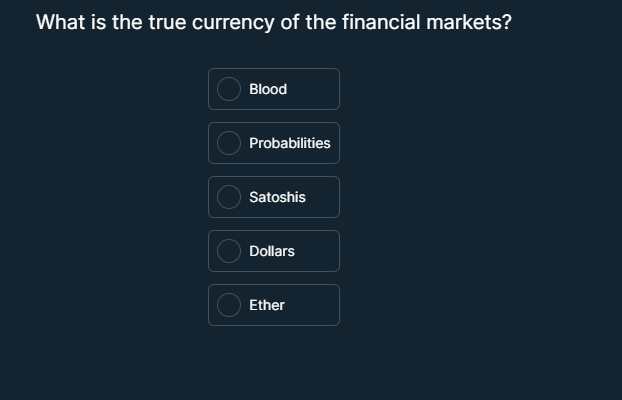
You are deploying a medium-term swing trading strategy. If the TPl changes from +0.6 to -0.2, what is most likely your optimal strategy? Prepare to buy =111 Sell Do nothing Prepare to sell You are deploying a medium-term swing trading strategy. If the TPI changes from -0.5 to -0.15, what is most likely your optimal strategy? O Do nothing O Prepare to sell O Sell Prepare to buy BuyAssume a strategy starting on 1/1/2018, and finishing 1/1/2022. Imagine this ideal strategy is consistent with the principles/technique | have highlighted earlier in the masterclass on the \"concept of extracting alpha out of the full market cycle". If the total number of trades is, say, 40... What would the ''Average number of bars in trade:' metric show, assuming you're using the 1D (= Ela v Select the closest answer: Hint: Review the concept in IMC lesson 43 Which of these is categorized as a fundamental indicator in an SDCA system? MVRV Ratio C Power law oscillator C Bitcoin Rainbow Chart C Adjusted Mayer MultipleWhat is 'Dovish' monetary policy? Perform external research O The expansion of the money supply. The quarantine of high default probability MBS's from the open market. O FED operations to increase inter-bank liquidity to drive down interest rates. The monetization of extreme debt burdens. The printing of dollars with images of doves on them. All the above. C Selections A to DWhy is the Sortino Ratio considered "better" than Sharpe Ratio Sharpe ratio rewards upside volatility. The denominator for Sharpe ratio uses downside volatility. Omega Ratio is better. It doesn't punish upside volatility. They are the same thing. Discretionary technical analysis [??7?] Does not work, because its just your biases being displayed through your drawings. Does not work, because we haven't become good enough at it yet Does not work in crypto because of volume manipulation by the largest exchanges colluding to run stop-losses and 'paint' certain price reversal patterns to induce contrarians into taking losing positions. Works some of the time What is the difference between the sortino and the omega ratio? Omega uses semivariance for the denominator and sortino uses semivariance in the numerator. Omega uses standard deviation of negative returns for the denominator and sortino uses standard deviation of total returns in the denominator. Omega uses semivariance for the denominator and sortino uses the probability density function of negative returns in the denominator. There is no difference, they both use the accumulated variability of returns to make a judgement on portfolio efficiency. Omega uses a probability density function of negative returns for the denominator and sortino uses downside deviation for the denominator. You're deploying a long term SDCA strategy. Market valuation analysis shows a Z-Score of 1.3 Long Term TPl is @ 0.4 (Previous: -0.2) Market valuation has been below 1.5Z for a few months. What is your optimal strategic choice? This is a combination of what you've learned in Long term and Medium term sections Do not start DCA Continue DCA Stop DCA Pause DCA Deploy LS| of remaining capital You're deploying a long term SDCA strategy. Market valuation analysis shows a Z-Score of 0.99 Long Term TPl is @ -0.5 (Previous: -0.25) Market valuation has not been below 1.5Z yet. What is your optimal strategic choice? This is a combination of what you've learned in Long term and Medium term sections Do not start DCA Continue DCA 1 (s] s J D0 Pause DCA Deploy LS| of remaining capital You're deploying a long term SDCA strategy. Market valuation analysis shows a Z-Score of 1.64 Long Term TPl is @ -0.9 (Previous: -0.7) Market valuation has been below 1.5Z for a couple of months. What is your optimal strategic choice? This is a combination of what you've learned in Long term and Medium term sections Do not start DCA Continue DCA Stop DCA Pause DCA Deploy LS| of remaining capital \fWhich one of these "assets" is tangent to the efficient frontier? (Original vanilla MPT) No calculations necessary. O Sharpe: 2.2. Omega 5. C Sharpe: 1.9. Omega 8. Sharpe: 2. Omega 4. Sharpe: 1.3. Omega 8.1.A secret service courier carrying a briefcase with the codes to the USA's nuclear defense system has a mean delivery time of 1.3 hours with a standard deviation of 20 minutes. What is the probability you'll get your hands on the nuclear defense codes before North Korea launch a ICBM attack on the USA in 68 minutes. Hint: Think back to your stats lessons 3413% 30.85% 97.72% 2.28% S 8413% 15.87% iRy Of all the price analysis methodologies that exist, which are the foundational methods. Trading & Investing. Volume & sentiment. Mean reversion & liquidity extraction. Longing & Shorting. On-chain & Macroeconomic. Mean reversion & trend following. \f\fOpen Tradingview and load up the default TV @ Supertrend Strategy @ @' from the indicators menu. Chart: INDEX:BTCUSD Properties: 1k$ capital, 100% equity, 0 pyramiding, 0 slippage. Using the replay function, cut the timeseries at 29/5/2022. What is the sortino ratio of the strategy backtest? C 3.88 C 2.53 C 2.91 C 1.85 C 1.81 C 0.45Continuation of previous question: What is the profitability percentage of the long-only trades? Modern portfolio theory uses which two measurements to classify the efficiency of assets. Expected return & Probability density of negative returns Expected return & Standard density of millivariance Expected return & Standard deviation Expected return & Semivariance Is the following indicator trend following, or mean reverting? = "T|' Jli | Mean reversion Trend following Is the following indicator trend following, or mean reverting? i 1 / TR R L ) i Fl . S e Trend following Mean reversion How does one achieve 'time-coherence'? Volume Profiling. Price based levels of interest based on the aggregation of purchase data. Cannot be falsified. Entry Price/Exit Price Structuring. Strategic forecasting through the use of trend lines, Fibonacci levels and oscillator studies. Macroeconomic. Asset class trends derived from information coming from the real economy. Closely related to capital flows. Through the manipulation of chart time resolution or indicator calibrations to make the indicators operate over the same intended signal period. Lack of time coherence leads to: Excessive mixed interference. Signals converted into market beta. Excessive constructive interference. Signals producing too much alpha. Excessive destructive interference. Signals not producing alpha. Excessive constructive interference. Signals alpha decaying. Assuming the omega ratio is a superior method of classifying asset efficiency relative to the sortino ratio, which two measurements should ACTUALLY be used in modern portfolio theory? Expected return & Standard density of millivariance Expected return & Standard deviation Expected return & Semivariance Probability density of positive returns & Probability density of negative returns Which two of these indicators are 'time-coherent'. SELECT TWO IMAGES Select 2 choice 3 choice 4 \fO Bl JUSDG 27429 St o A sentiy sentiment on Bitcoins and Bitcoin price You will need this image for the next question Using the Public MACRO BITCOIN scorecard spreadsheet (linked in its associated masterclass lesson - Long Term 32), create a COPY of it and perform a complete valuation analysis for the date 1/2/2023 (dd/mm/yyyy). The '"Overall Position' results in: Select closest answer What is the highest form of analysis? Volume Profiling. Price based levels of interest based on the aggregation of purchase data. Cannot be falsified. Systemization. The method of aggregating multiple informational inputs to eliminate human bias and increase Il E 1 Macroeconomic. Asset class trends derived from information coming from the real economy. Closely related to (ool =1 R Lo TR Entry Price/Exit Price Structuring. Strategic forecasting through the use of trend lines, Fibonacci levels and oscillator studies. Once you complete the masterclass, what is the recommended development path for your personal systems? Put the probabilities in your favor when starting out. C Any order C Development in line with the masterclass sequence (SDCA, TPI, Strat/Algo UMPT, Python) C Development in line with maximizing opportunity cost (Strat/Algo UMPT, Python, TPI, SDCA)High crypto market correlation... O Incentivizes broad diversification Renders broad diversification useless Incentivizes narrow diversification Renders narrow diversification useless\fAssuming the sortino ratio is a superior method of classifying asset efficiency, which two measurements should be used in modern portfolio theory instead (a.k.a. Post-modern portfolio theory) Expected return & Probability density of negative returns Expected return & Standard density of millivariance Expected return & Standard deviation Expected return & Downside deviation Use portfolio visualizer to find the omega optimized portfolio weights for buy-and-hold ^BTC & ^ETH. - Start/End: Sep 2015 - March 2024. - Month-to-month time periods. - Target return 0%. Don't ask me "how to use PV", it's easy as fuck, just experiment with it for 5 minutes you fucking lazy bastards. C BTC 45.44%. ETH 54.56% C BTC 37.89%. ETH 62.11% C BTC 65.83%. ETH 34.17% C BTC 55.72%. ETH 44.28%Which one of these "assets" is tangent to the efficient frontier? (Ultimate-MPT) No calculations necessary. C Sharpe: 1.9. Omega 8. C Sharpe: 2.2. Omega 5. C Sharpe: 1.3. Omega 8.1. O Sharpe: 2. Omega 4.What is the true currency of the financial markets? Probabilities Satoshis (]| T
Step by Step Solution
There are 3 Steps involved in it
1 Expert Approved Answer
Step: 1 Unlock
Question Has Been Solved by an Expert!
Get step-by-step solutions from verified subject matter experts
Step: 2 Unlock
Step: 3 Unlock
Students Have Also Explored These Related Finance Questions!