

Question: You are evaluating RTC Foundation portfolio and considering making recommendation for policy portfolio. The portfolio has current market value of $250 million. Considering the aggressive
You are evaluating RTC Foundation portfolio and considering making recommendation for policy portfolio. The portfolio has current market value of $250 million. Considering the aggressive nature of its trustees, the risk tolerance of the portfolio is aggressive with a conservative spending rate of 4%. The return objective is set at 9.5%. The measured risk aversion for RTC is R(A)=2.5. The portfolio has the capacity to accept standard deviation of 15% or less. The table on the next page provides clients capital market expectations and the corner portfolios.
a) Based on Mean-Variance analysis, determine the strategic asset allocation that is most appropriate for RTC. Justify your answer. b) Identify the corner portfolio most likely to be the tangency portfolio and explain its appropriateness for RTC in selecting an optimal strategic asset allocation. Assume Risk-Free rate of return of 2.0%. c) Determine the most appropriate asset allocation for RTC given its measured risk aversion and the return objective if RTC had to choose only one portfolio from all the corner portfolios given in the exhibit. Contrast the asset allocation to the strategic asset allocation chosen as optimal in part (a). d) Using Sharpe ratio, which is the best performing portfolio. Explain, why a client would not choose this portfolio.
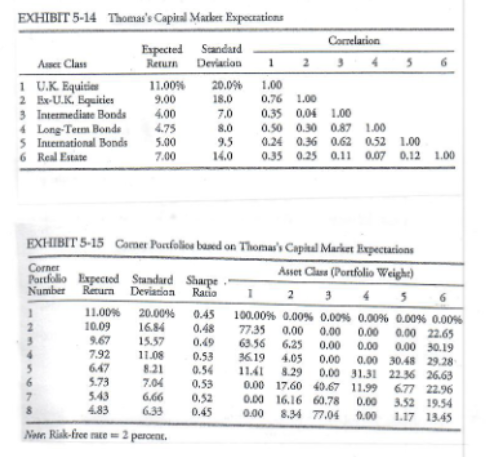
EXHIBIT 5-14 Thomas's Capital Market Expectations Espected Sundad Carrelation Amet Class Return Deviacion 1 1 U.K. Equities 11.00% 20.0% 1.00 2 Ex-U.K. Equities 9.00 18.0 0.76 1.00 3 Intermediate Bonds 4.00 7.0 0.35 0.04 1,00 4 Long-Term Bonde 4.75 8.0 0.50 0.30 0.87 1.00 5 International Bonds 5.00 9.5 0.24 0.36 0.62 052 1.00 6 Real Estate 7.00 0.35 0.25 0.11 0.07 0.12 1.00 16.0 EXHIBIT 5-15 Comer Portfolios based on Thomas's Capital Market Expectations Corner Portfolio Expected Stundud Sharpe Anet Class (Portfolio Weight) Number Retum Deviation Ratio 1 11.00% 20.00% 0.45 100.00% 0.00% 0.00% 0.00% 0.00% 0.00% 2 10.09 16.84 0.48 77.35 0.00 0.00 0.00 0.00 22.65 9.67 15.57 0.69 63.56 6.25 0.00 0.00 0.00 30.19 7.92 11.08 0.53 3619 4.05 0.00 0.00 30.48 29.28 647 8.21 0.54 11.41 8.29 0.00 31.31 22:36 26.63 5.73 7.04 0.53 0.00 17.60 40.67 11.99 677 22.96 5.43 6.66 0.52 0 , 617 0.00 3.52 19.54 4.83 6.33 0.45 0.00 8.34 77.04 0.00 1.17 13.45 Noor Risk-free race = 2 percent. EXHIBIT 5-14 Thomas's Capital Market Expectations Espected Sundad Carrelation Amet Class Return Deviacion 1 1 U.K. Equities 11.00% 20.0% 1.00 2 Ex-U.K. Equities 9.00 18.0 0.76 1.00 3 Intermediate Bonds 4.00 7.0 0.35 0.04 1,00 4 Long-Term Bonde 4.75 8.0 0.50 0.30 0.87 1.00 5 International Bonds 5.00 9.5 0.24 0.36 0.62 052 1.00 6 Real Estate 7.00 0.35 0.25 0.11 0.07 0.12 1.00 16.0 EXHIBIT 5-15 Comer Portfolios based on Thomas's Capital Market Expectations Corner Portfolio Expected Stundud Sharpe Anet Class (Portfolio Weight) Number Retum Deviation Ratio 1 11.00% 20.00% 0.45 100.00% 0.00% 0.00% 0.00% 0.00% 0.00% 2 10.09 16.84 0.48 77.35 0.00 0.00 0.00 0.00 22.65 9.67 15.57 0.69 63.56 6.25 0.00 0.00 0.00 30.19 7.92 11.08 0.53 3619 4.05 0.00 0.00 30.48 29.28 647 8.21 0.54 11.41 8.29 0.00 31.31 22:36 26.63 5.73 7.04 0.53 0.00 17.60 40.67 11.99 677 22.96 5.43 6.66 0.52 0 , 617 0.00 3.52 19.54 4.83 6.33 0.45 0.00 8.34 77.04 0.00 1.17 13.45 Noor Risk-free race = 2 percent
Step by Step Solution
There are 3 Steps involved in it

Get step-by-step solutions from verified subject matter experts