

You are examining the sales performance of three different products (Product X, Product Y, and Product Z)
Fantastic news! We've Found the answer you've been seeking!
Question:
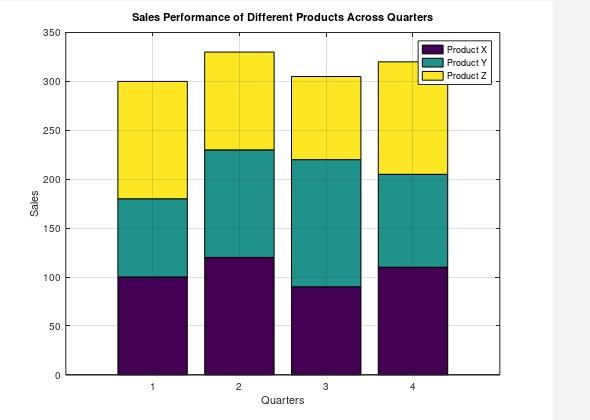
You are examining the sales performance of three different products (Product X, Product Y, and Product Z) over four quarters of a year. The sales data for each product in each quarter is stored in arrays.
Use MATLAB to create a stacked bar plot displaying the sales performance of the three products across the four quarters. Analyze and discuss any trends or comparisons visible in the plotted sales data. Sales Performance of Different Products Across Quarters.
Expert Answer:

Related Book For 
Accounting What the Numbers Mean
ISBN: 978-0078025297
10th edition
Authors: David H. Marshall, Wayne W. McManus, Daniel F. Viele
Posted Date:
