

Question: You are given the following information about the function f(x): a) Domain: {x E R, x at -1} b) Vertical Asymptote: x = -1; Horizontal
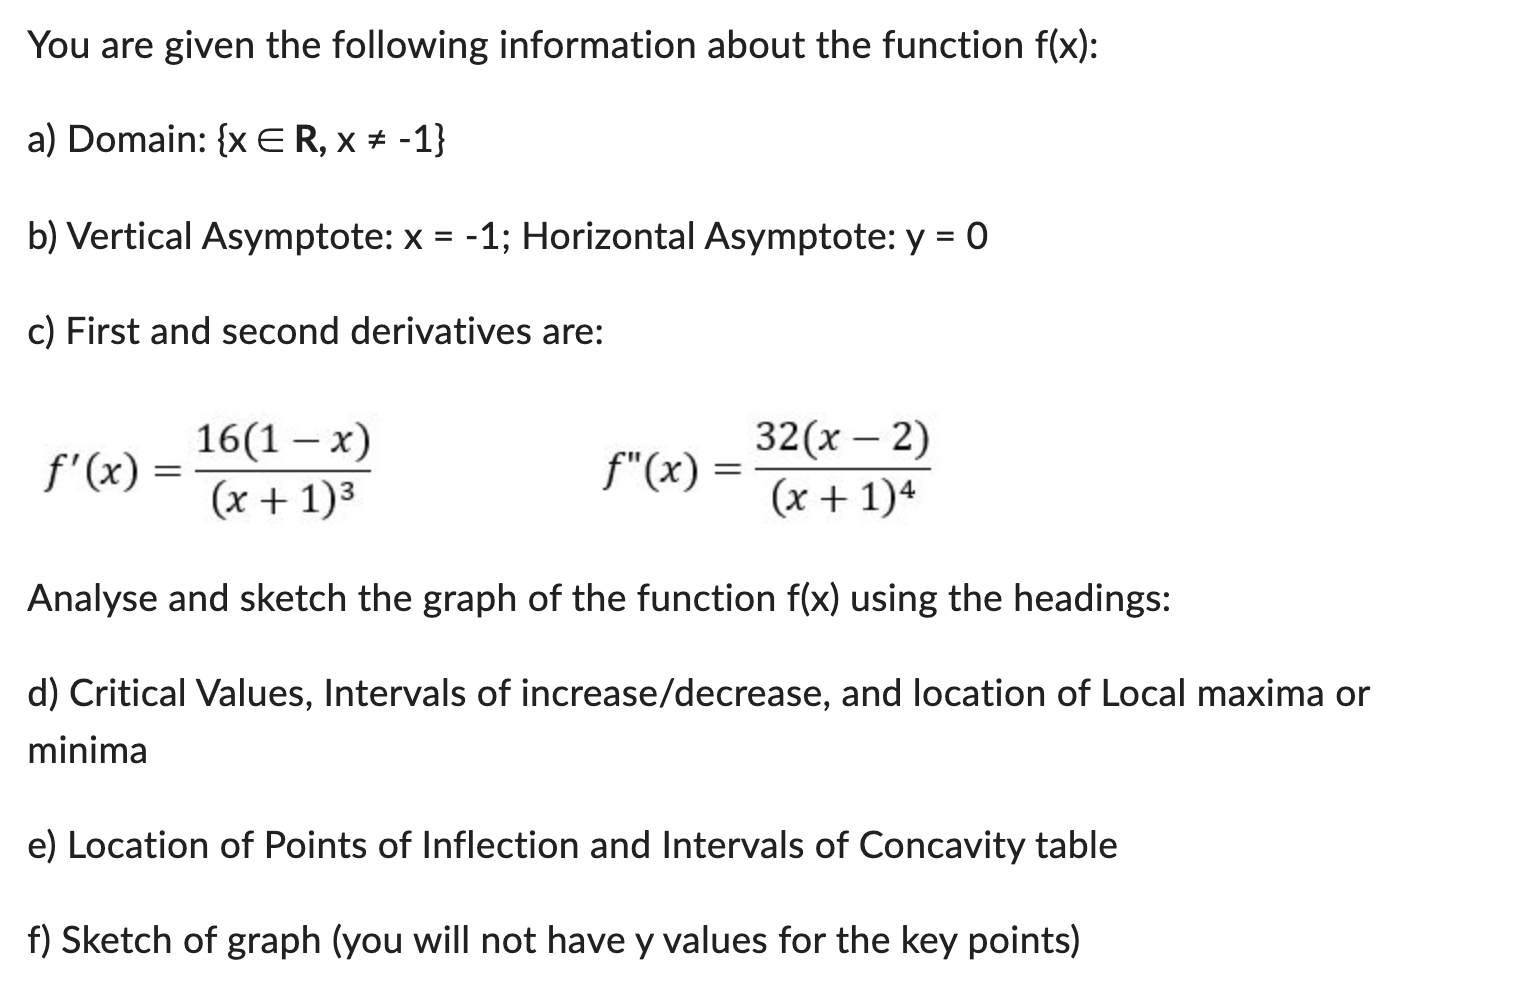

You are given the following information about the function f(x): a) Domain: {x E R, x at -1} b) Vertical Asymptote: x = -1; Horizontal Asymptote: y = 0 c) First and second derivatives are: , 16(1 x) .. 32(x 2) f(x)=3 f(x)=4 (x + 1) (x + 1) Analyse and sketch the graph of the function f(x) using the headings: d) Critical Values, Intervals of increase/decrease, and location of Local maxima or minima e) Location of Points of Inflection and Intervals of Concavity table f) Sketch of graph (you will not have y values for the key points)
Step by Step Solution
There are 3 Steps involved in it
1 Expert Approved Answer
Step: 1 Unlock

Question Has Been Solved by an Expert!
Get step-by-step solutions from verified subject matter experts
Step: 2 Unlock
Step: 3 Unlock