

Question: You are given the sample mean and the population standard deviation. Use this information to construct the 90% and 95% confidence intervals for the population
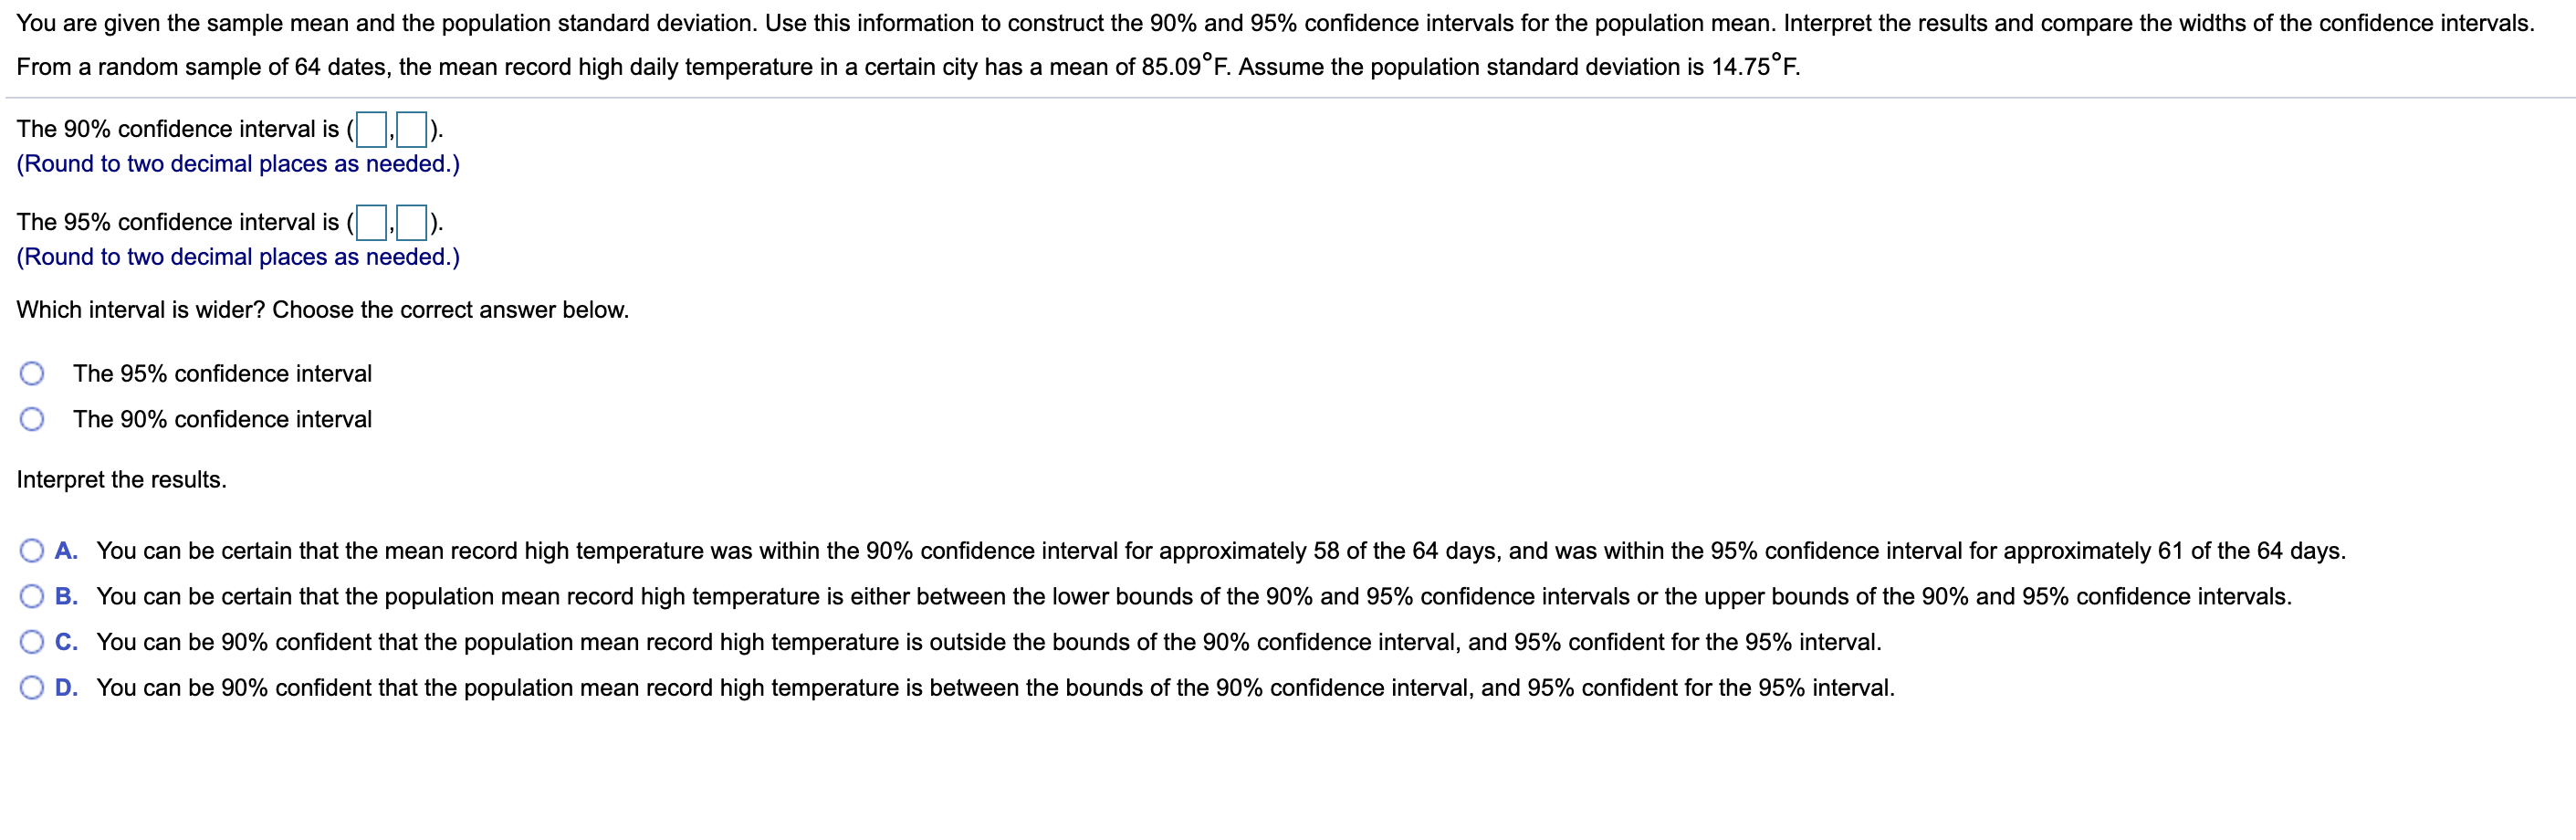
You are given the sample mean and the population standard deviation. Use this information to construct the 90% and 95% confidence intervals for the population mean. Interpret the results and compare the widths of the confidence intervals. From a random sample of 64 dates, the mean record high daily temperature in a certain city has a mean of 85.09 F. Assume the population standard deviation is 14.75 F. The 90% confidence interval is (). (Round to two decimal places as needed.) The 95% confidence interval is (,). (Round to two decimal places as needed.) Which interval is wider? Choose the correct answer below. O The 95% confidence interval O The 90% confidence interval Interpret the results. A. You can be certain that the mean record high temperature was within the 90% confidence interval for approximately 58 of the 64 days, and was within the 95% confidence interval for approximately 61 of the 64 days. O B. You can be certain that the population mean record high temperature is either between the lower bounds of the 90% and 95% confidence intervals or the upper bounds of the 90% and 95% confidence intervals. O C. You can be 90% confident that the population mean record high temperature is outside the bounds of the 90% confidence interval, and 95% confident for the 95% interval. O D. You can be 90% confident that the population mean record high temperature is between the bounds of the 90% confidence interval, and 95% confident for the 95% interval
Step by Step Solution
There are 3 Steps involved in it

Get step-by-step solutions from verified subject matter experts