

Question: You are given the sample mean and the population standard deviation. Use this information to construct the 90% and 95% confidence intervals for the population
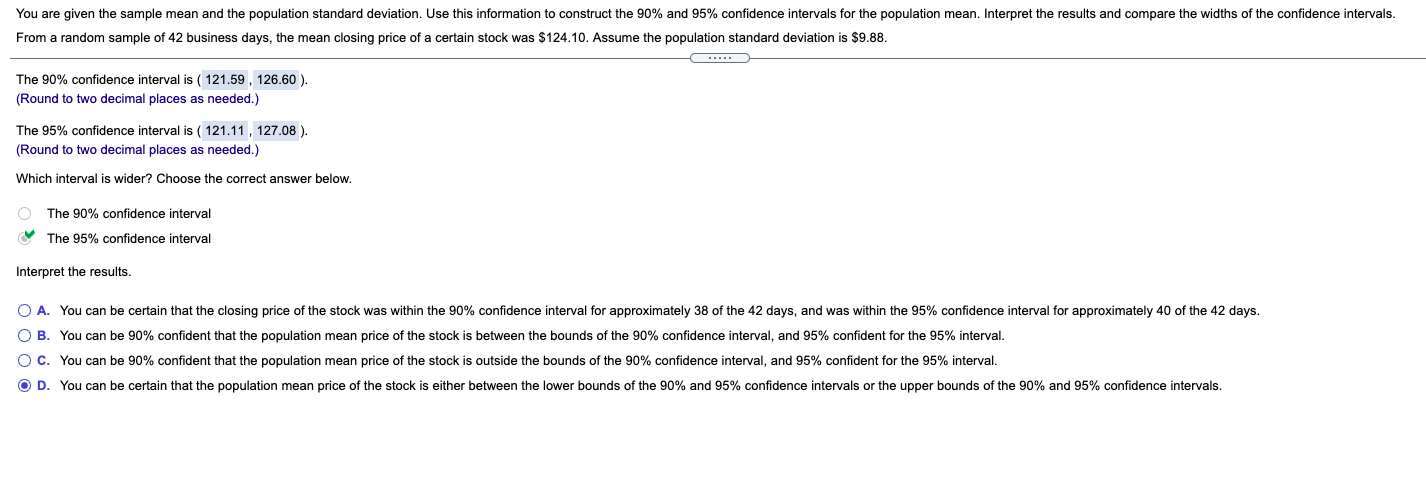
You are given the sample mean and the population standard deviation. Use this information to construct the 90% and 95% confidence intervals for the population mean. Interpret the results and compare the widths of the confidence intervals. From a random sample of 42 business days, the mean closing price of a certain stock was $124.10. Assume the population standard deviation is $9.88. The 90% confidence interval is ( 121.59 , 126.60 ). (Round to two decimal places as needed.) The 95% confidence interval is ( 121.11 , 127.08 ). (Round to two decimal places as needed.) Which interval is wider? Choose the correct answer below. O The 90% confidence interval The 95% confidence interval Interpret the results. O A. You can be certain that the closing price of the stock was within the 90% confidence interval for approximately 38 of the 42 days, and was within the 95% confidence interval for approximately 40 of the 42 days. O B. You can be 90% confident that the population mean price of the stock is between the bounds of the 90% confidence interval, and 95% confident for the 95% interval. O C. You can be 90% confident that the population mean price of the stock is outside the bounds of the 90% confidence interval, and 95% confident for the 95% interval. O D. You can be certain that the population mean price of the stock is either between the lower bounds of the 90% and 95% confidence intervals or the upper bounds of the 90% and 95% confidence intervals
Step by Step Solution
There are 3 Steps involved in it

Get step-by-step solutions from verified subject matter experts