

Question: You are going to create a multi - system model that describes oxygen delivery to a tissue taking into consideration hemodynamics, oxygen transport and consumption,
You are going to create a multisystem model that describes oxygen delivery to a tissue taking into
consideration hemodynamics, oxygen transport and consumption, and metabolic feedback
mechanisms. You will model two different pathologies involving sudden drops in blood pressure:
anaphylactic shock and sepsisseptic shock.
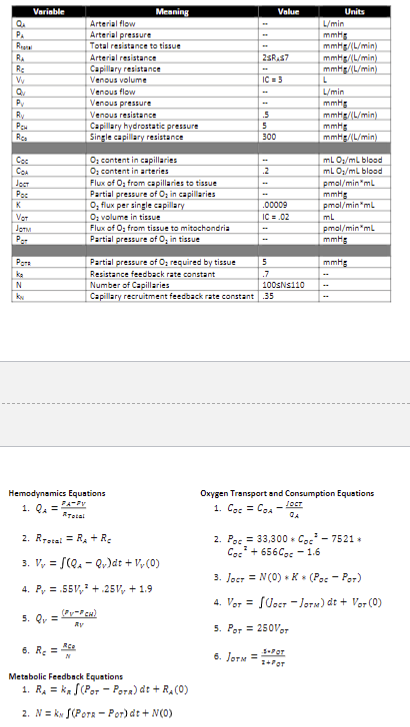
A Using Simulink, create a multisystemcompartment model based on the equations and
information given below. Use the diagram below to guide you in organizing your model. As
shown in the diagram, use the area functionality in Simulink to block off each
systemcompartment in your unit and label it accordingly. Label each variable from the table
below as a line or block. Organize your model neatly, avoiding crossing your lines. Total
protonic reversal! You should have three scopes logging data to the workspace P OT RA N
B Model Variation : Use a constant value for PA as your input to model a healthy individual. Set
your simulation time to seconds where second of model time represents minute of real
time Save this version of the model. In your script, open and run your Simulink model. Print an
image of your model and include it in a text section of your code. Create a set of three subplots
in a single column showing the steady state plots for P OT R A and N vs time. Set a color for
your each line that not the default and set your line width to
C Model Variation Analysis: What is the steady state value for P OT Approximately how long did
it take to reach steady state? Where the feedback mechanisms activated for N and RA Why or
why not? If they were activated, was the maxima or minima reached, and if so how long did it
take to reach that point? If the feedback loops waswere activated, how did this affect the
POT Answer these questions in a text section of your script.
D Model Variation : To model anaphylactic shock, you will use a D look up table. Set your
simulation time to seconds where second of model time represents minute of real
time
For the first three minutes of your simulation, the persons arterial pressure is normal.
However, after three minutes they start going into anaphylactic shock and their blood
pressure begins to decrease linearly. Seven minutes after the onset of anaphylactic
shock their arterial pressure has dropped to mmHg At this point, someone uses an
EpiPen to inject epinephrine. Their blood pressure returns to normal within three
minutes after the injection and remains stable.
Use this information to set your D lookup table. Save this version of the model. In your script,
open and run your Simulink model. Print an image of your model and include it in a text section
of your code. Create a set of three subplots in a single column showing the steady state plots
for P OT RA and N vs time. Use the same line colors for each plot that you used for Variation
and set your line width to
E Model Variation Analysis: Describe what occurs during anaphylaxis. Approximately how long
after the onset of anaphylaxis did it take for the partial pressure of oxygen in the tissue to drop
below the required value? What happened to the partial pressure of oxygen in the tissue upon
administration of epinephrine? Based on the plot, over which time ranges is cell death most
likely to occur and why? Where the feedback mechanisms activated for N and R A Why or why
not? If they were activated, was the maxima or minima reached, and if so how long did it take
to reach that point? If the feedback loops waswere activated, how did this affect the P OT
Answer these questions in a text section of your script.
F Model Variation : To model sepsisseptic shock, you will use a ramp block, with an initial
output of normal arterial pressure and a slope of Set your simulation time to seconds
where second of model time represents minute of real time Save this version of the
model. In your script, open and run your Simulink model. Print an image of your model and
include it in a text section of your code. Create a set of three subplots in a single column
showing the steady state plots for P OT RA and N vs time. Use the same line colors for each plot
that you used for Variation and set your line width to
G Model Variation Analysis: Describe what occurs during sepsisseptic shock. Approximately
how long after the onset of septic shock did it take for the partial pressure of oxygen in the
tissue to drop below the required value? Based on the plot, over which time ranges is cell death
most likely to occur and why? Where the feedback mechanisms activated for N and R A Why or
why not? If they were activated, was the maxima or minima reached, and if so how long did it
take to reach that point? If the feedback loops waswere activated, how did this affect the
POT Answer these questions in a text section of your script.
answer all questions, providing matlab code and simulink diagrams.
Step by Step Solution
There are 3 Steps involved in it
1 Expert Approved Answer
Step: 1 Unlock

Question Has Been Solved by an Expert!
Get step-by-step solutions from verified subject matter experts
Step: 2 Unlock
Step: 3 Unlock