

Question: You are going to develop an R-chart based on range statistics, and you are using a sample size of 8 for your charting purposes.
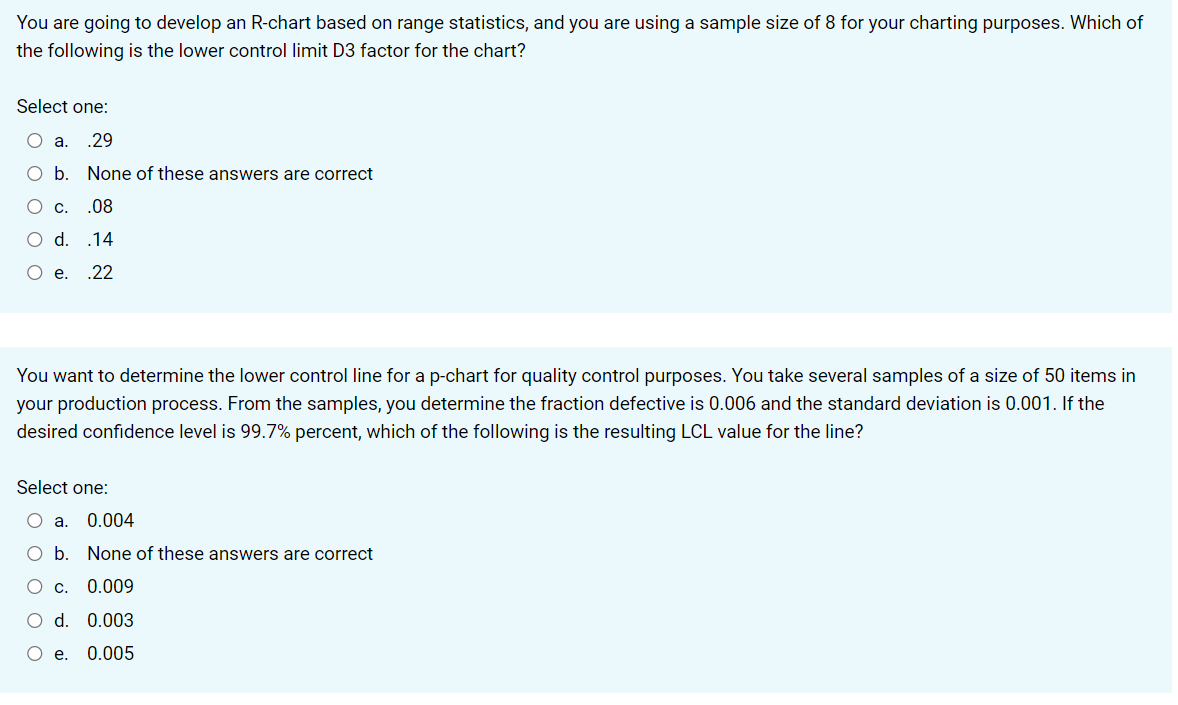
You are going to develop an R-chart based on range statistics, and you are using a sample size of 8 for your charting purposes. Which of the following is the lower control limit D3 factor for the chart? Select one: O a. .29 O b. None of these answers are correct O c. .08 O d. .14 e. .22 You want to determine the lower control line for a p-chart for quality control purposes. You take several samples of a size of 50 items in your production process. From the samples, you determine the fraction defective is 0.006 and the standard deviation is 0.001. If the desired confidence level is 99.7% percent, which of the following is the resulting LCL value for the line? Select one: O a. 0.004 O b. None of these answers are correct O c. 0.009 O d. 0.003 O e. 0.005
Step by Step Solution
3.33 Rating (165 Votes )
There are 3 Steps involved in it
c 08 Explanation D3 29sqrt8 08 The lower control limit for ... View full answer

Get step-by-step solutions from verified subject matter experts