

Question: You are going to test whether aggregate manufacturing in the United States exhibits increasing, decreasing or constant returns to scale using data from the 2016
You are going to test whether aggregate manufacturing in the United States exhibits increasing, decreasing or constant returns to scale using data from the 2016 Annual Survey of Manufactures.The Excel file provided in the google drive link below includes data on output (measured in $ value), capital expenditures and labor expenditures for each of the 50 states plus the District of Columbia.
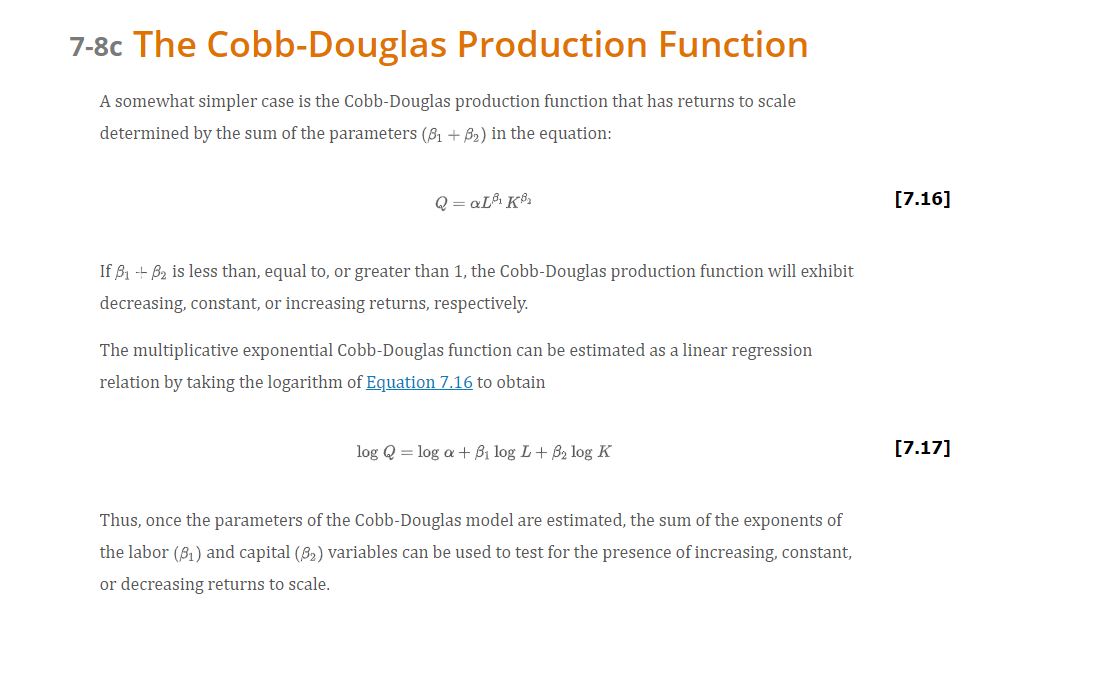
We will assume that manufacturing is described by the Cobb Douglas production:
a.Estimate the production function using linear regression (see section 7-8c of the ME-AST textbook for instructions on how to convert the Cobb Douglas function into a form that can be estimated with linear regression.You will need to convert the data in the Excel file to match the transformation needed before estimating the regression).
Google drive link - data in the excel file
https://docs.google.com/file/d/1lUriafKC025f5v3wpW5nZ_BIj48j7vb2/edit?usp=docslist_api&filetype=msexcel
\f
Step by Step Solution
There are 3 Steps involved in it

Get step-by-step solutions from verified subject matter experts